“When is the best time to buy stocks?” Most people mean one of three things: should I wait for a dip, is it a mistake to buy near a record, and how do I know a bear market is over? We tested all three on S&P 500 daily closes since 1955.
At the November 16, 2026 close the S&P 500 stood at 7,417, down 1.9% on the day and 5.2% below its October 6 record of 7,819. None of the four warning signals was firing and the market regime read bull.
We grouped every trading day since 1955 by how far the S&P 500 was below its last record, then measured the next one, three and five years.
| Bought when the S&P 500 was (biggest result first) | Days | Next 12 months, median | 12 months lost money | Next 3 years, a year | Next 5 years, a year |
|---|---|---|---|---|---|
| 30% or more below its record | 1,008 | +19.6% | 4% | +11.3% | +9.9% |
| 10% to 20% below | 3,666 | +12.2% | 28% | +8.5% | +8.0% |
| 20% to 30% below | 2,076 | +10.6% | 18% | +9.4% | +6.1% |
| Any day | 18,090 | +10.3% | 26% | +8.3% | +8.3% |
| At a record close | 1,340 | +10.1% | 27% | +7.7% | +8.1% |
| 5% to 10% below (today: 5.2%) | 2,840 | +9.0% | 32% | +7.6% | +8.0% |
| Less than 5% below | 7,160 | +8.3% | 29% | +8.0% | +8.7% |
S&P 500 daily closes, price only; days overlap. 3- and 5-year figures are median annualized returns.
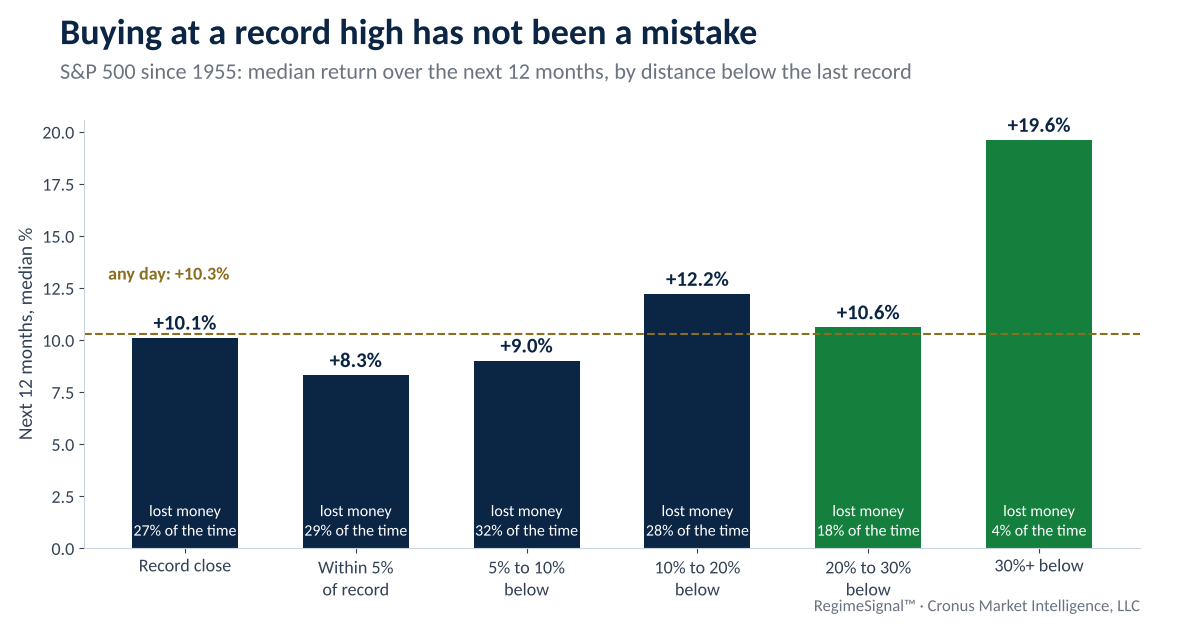
Buying at a record close has done almost exactly as well as buying on any other day: a median of about 10% over the next year, losing money a little over a quarter of the time. The clearly better entries came only after deep falls of 30% or more, which happened on about one day in eighteen. Waiting for those is waiting for a bear market.
Many investors hold cash and plan to buy “on the next pullback.” We tested that rule on every day since 1955: wait up to 12 months for a price 10% lower than today; if it never comes, buy after 12 months anyway.
Waiting for a dip wins when a real decline is coming, and loses the rest of the time. That makes it a forecast in disguise, and it is only as good as the forecast.
By the usual definition, a bear market ends when the index closes 20% above its low. That confirmation always comes late. Here is what buying at that point has meant, measured from each bear market’s final low, for every bear market since 1955.
| Bear market (biggest result first) | Fall | 20% above the low on | Trading days after the low | 12 months from the low | 12 months from the 20% confirmation |
|---|---|---|---|---|---|
| 2020 | −33.9% | Apr 8, 2020 | 12 | +74.8% | +50.1% |
| 2007 to 2009 | −56.8% | Mar 23, 2009 | 10 | +68.6% | +42.7% |
| 1980 to 1982 | −27.1% | Sep 14, 1982 | 22 | +57.7% | +34.4% |
| 1956 to 1957 | −21.5% | Jul 25, 1958 | 191 | +31.5% | +27.8% |
| 2022 | −25.4% | Jun 8, 2023 | 164 | +21.0% | +24.8% |
| 1973 to 1974 | −48.2% | Nov 5, 1974 | 23 | +34.6% | +17.8% |
| 1961 to 1962 | −28.0% | Dec 6, 1962 | 113 | +32.7% | +17.5% |
| 1968 to 1970 | −36.1% | Sep 28, 1970 | 87 | +44.5% | +16.3% |
| 2000 to 2002 | −49.1% | Nov 21, 2002 | 31 | +33.7% | +10.9% |
| 1987 | −33.5% | Mar 8, 1988 | 64 | +21.4% | +9.1% |
| 1966 | −22.2% | Feb 14, 1967 | 88 | +33.2% | +2.4% |
Fall measured close to close from the record before each bear market to its lowest close. Price only.
Measured from each bear market’s final low, buying on the 20% confirmation worked every time, with a median gain of 17.8% over the next year, but it gave up roughly half of the median 33.7% gain from the exact low. The confirmation took a median of 64 trading days, about three months, to arrive.
The table above has the benefit of hindsight: it knows which low was the final one. Three times since 1955, the S&P 500 rallied 20% from a bear-market low, meeting the usual definition of a new bull market, and then fell to a new low anyway.
| False start (biggest rally first) | Low | Rally to | Rally | Fall from the rally top to the final low |
|---|---|---|---|---|
| 2008 to 2009 | Nov 20, 2008 | Jan 6, 2009 | +24.2% | −27.6% |
| 2001 to 2002 | Sep 21, 2001 | Jan 4, 2002 | +21.4% | −33.8% |
| 2002 | Jul 23, 2002 | Aug 22, 2002 | +20.7% | −19.3% |
A false start is a rally of 20% or more from the lowest close so far, after the index was already down 20% from its record, that was followed by a lower close before the bear market ended. Close to close, price only.
All three came in the two deepest bear markets of the period, 2000 to 2002 and 2007 to 2009. A temporary rebound and a new bull market look the same at first; what separates them is whether the conditions behind the decline have actually turned. Waiting for certainty is expensive, and buying the exact bottom is luck.
RegimeSignal’s warning signals look for the conditions that came before declines; its Recovery signal watches for the turn back up. None of this is personal advice on when you should invest: that depends on your goals, timeline and how much risk you can carry.
| RegimeSignal signal | Watches for | Right when it fired |
|---|---|---|
| Bear signal | a 20%+ decline | 86% |
| Correction signal | a 10%+ decline | 84% |
| Pullback signal | a 5%+ decline | 83% |
| Recovery signal | the turn back up | — |
Out-of-sample precision on historical and validation data; 84% on average. Walk-forward validated, PhD validated and independently audited.
The Bear signal flagged 8 out of 8 bear markets since 1950. A hypothetical study that stepped aside only when the bear or correction alerts fired, December 2000 to October 2025, finished 126% ahead of simply holding the S&P 500, with a deepest loss of −12.7% versus −50.8% for the index (pre-tax, before fees). As of the November 16, 2026 close, none of the four warning signals was firing.
See today’s market call and whether our warning signals are firing →Free 15-minute preview · no signup · no credit card · no downloadS&P 500 daily closes from Yahoo Finance (^GSPC), January 1955 through November 16, 2026, price only; we start in 1955 because the index first regained its 1929 record in September 1954. Distance below the record uses the highest close to date. The dip test covers start days from 1955 through late 2024 so every start has a full year. A bear market is a fall of 20% or more, close to close; it is confirmed over when the index closes 20% above its lowest close. Past results do not indicate future results.
Historically, the clearly better entries came after deep falls: since 1955, buying when the S&P 500 was 30% or more below its record was followed by a median gain of 19.6% over the next year. Outside of bear markets, the day you bought mattered much less than staying invested.
History says no. Since 1955, buying at a record close was followed by a median 12-month gain of 10.1%, against 10.3% for any day, and lost money 27% of the time versus 26%.
Waiting for a 10% dip has usually cost money. Since 1955, the dip arrived within a year only 33% of the time, and in the median case waiting left an investor with about 7% fewer shares than buying at once.
By the usual rule, when the index closes 20% above its low. Measured from the final low, that took a median of 64 trading days for the 11 bear markets since 1955, and buying then returned a median 17.8% over the next year. But three 20% rallies, in 2001, 2002 and 2008, failed and fell to new lows. RegimeSignal's Recovery signal watches for the turn back up.
We do not give personal advice. As of November 16, 2026 the S&P 500 was 5.2% below its record, and none of RegimeSignal's four warning signals was firing.
More studies: should I sell my stocks? · is the stock market overvalued? · is a bear market coming? · stock market correction or bear market? · all research.
Try RegimeSignal free for 15 minutes →No signup · no credit card · no download. Then a 7-day free trial; plans from $29 a month. See every plan on regimesignalai.com.Important disclosures. Published by Cronus Market Intelligence, LLC for general information and education only. Impersonal research that does not consider any reader’s objectives, finances or needs; not an offer, solicitation or recommendation to buy, sell or hold any security. Cronus is not a registered investment adviser or broker-dealer. Historical studies are prepared with the benefit of hindsight; the definitions used (distance below the highest close to date, a 10% dip within 12 months, a bear market as a fall of 20% close to close, its end as a close 20% above the low, a false start as a 20% rally followed by a lower low) were chosen by us and other choices give different results. Signal figures describe how the signals performed on historical data and in validation; they are not a guarantee of future accuracy, and a signal can miss or fire falsely. Data come from third-party sources believed reliable but not guaranteed. Investing involves risk, including loss of all money invested. Past performance, actual or hypothetical, does not indicate future results. S&P 500 is a registered trademark of S&P Dow Jones Indices LLC, which does not sponsor or endorse this research; an index cannot be invested in directly. RegimeSignal is a trademark of Cronus Market Intelligence, LLC. © 2026 Cronus Market Intelligence, LLC.
RegimeSignal™ · Cronus Market Intelligence, LLC · Santa Barbara, California