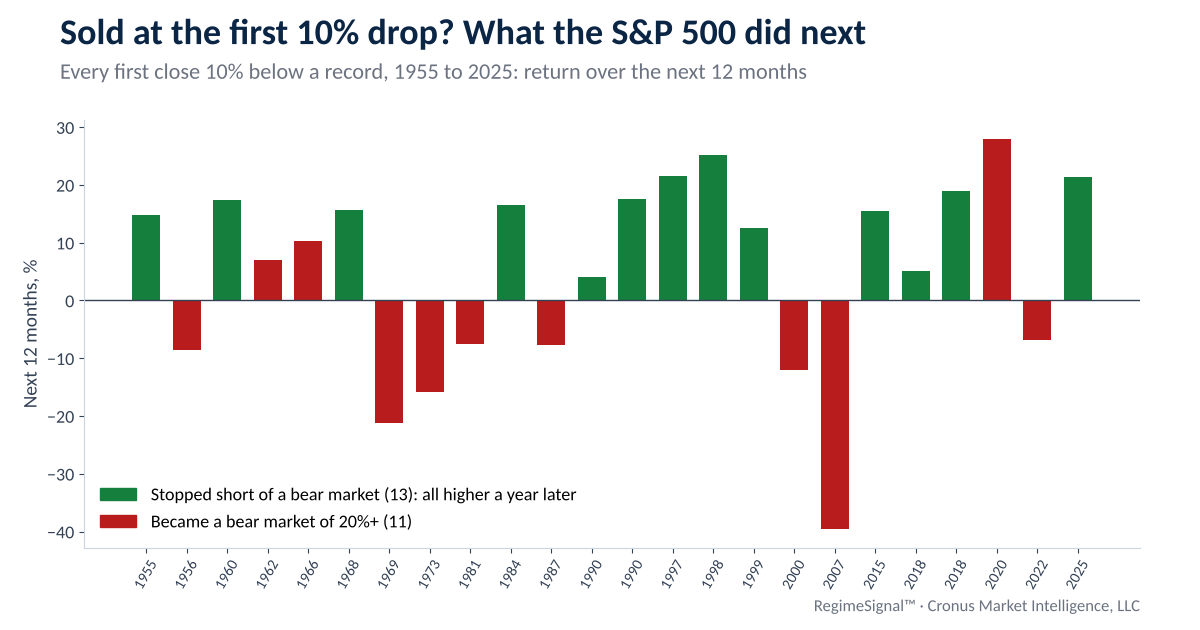
When the market drops, the question in almost every investor’s head is the same: should I sell my stocks before it gets worse? The honest answer is that a drop by itself does not tell you. We went back to every time since 1955 that the S&P 500 first closed 10% below a record and measured what happened next. Then we looked at the hidden cost of selling: the best days that come right after the worst ones.
At the November 16, 2026 close the S&P 500 stood at 7,417, down 1.9% on the day and 5.2% below its October 6 record of 7,819. None of the four warning signals was firing and the market regime read bull.
The S&P 500 closed 10% or more below its record for the first time in a decline 24 times from 1955 through 2025. Those 24 drops split almost evenly into two very different stories.
| After the first close 10% below a record (biggest result first) | Times | Higher 12 months later | Next 12 months, median | Further fall from there, median |
|---|---|---|---|---|
| Stopped short of a bear market | 13 | 13 of 13 | +15.7% | −3.4% |
| All 24 drops | 24 | 16 of 24 (67%) | +11.4% | −10.3% |
| Went on to a bear market of 20% or more | 11 | 3 of 11 | −7.7% | −24.9% |
S&P 500 daily closes, price only (dividends not included). “Further fall” is the deepest close after the 10% day and before the index set a new record; the worst was −51.9% in 2007 to 2009.
That is the dilemma in one table. Someone who sold at the first 10% drop was right to sell almost half the time, and wrong more than half the time. When the drop stopped short of a bear market, the index was higher a year later every single time, by a median of 15.7%. When it became a bear market, there was a median of another 25% still to fall.
Selling feels safe because it ends the pain. The cost shows up later, because the market’s biggest up days do not arrive in calm markets. Since 1955, 24 of the 25 best days for the S&P 500 came while the index was already 10% or more below its high, and 15 of them came within two weeks of one of the 25 worst days. An investor who sells in a slide is usually out of the market when those days arrive.
| $10,000 in the S&P 500, January 2000 to December 2025 | Ended with | Per year |
|---|---|---|
| Stayed invested every day | $47,041 | +6.1% |
| Missed the 5 best days | $29,067 | +4.2% |
| Missed the 10 best days | $20,945 | +2.9% |
| Missed the 20 best days | $12,174 | +0.8% |
| Missed the 30 best days | $7,743 | −1.0% |
Price only, dividends not included, before taxes and costs. Missing the best days while also missing the worst would change the result; this table shows why the timing of getting back in matters as much as the timing of getting out.
A market warning and a personal selling decision are two different things. These are the questions that usually matter more than the headline of the day:
These are general questions, not advice for your situation. A fee-only financial planner or your own adviser can help you answer them.
RegimeSignal does not tell anyone what to do with their own portfolio. It answers the market half of the question: is this drop showing the conditions that came before bigger declines? Its four signals read those conditions every trading day.
| RegimeSignal signal | Watches for | Right when it fired |
|---|---|---|
| Bear signal | a 20%+ decline | 86% |
| Correction signal | a 10%+ decline | 84% |
| Pullback signal | a 5%+ decline | 83% |
| Recovery signal | the turn back up | — |
Out-of-sample precision on historical and validation data; 84% on average. Walk-forward validated, PhD validated and independently audited.
The Bear signal flagged 8 out of 8 bear markets since 1950. A hypothetical study that stepped aside only when the bear or correction alerts fired, December 2000 to October 2025, finished 126% ahead of simply holding the S&P 500, and its deepest loss was −12.7% versus −50.8% for the index (pre-tax, before fees). Subscribers get an email the day a signal fires. As of the November 16, 2026 close, none of the four was firing.
See today’s market call and whether our warning signals are firing →Free 15-minute preview · no signup · no credit card · no downloadS&P 500 daily closes from Yahoo Finance (^GSPC), January 1955 through November 16, 2026, price only. We start in 1955 because the index first regained its 1929 record in September 1954. A first 10% drop is the first close 10% or more below the highest close to date; the next one is not counted until the index sets a new record. A bear market is a fall of 20% or more, close to close. Best and worst days are the 25 largest one-day gains and losses since 1955; “within two weeks” means within 10 trading days. Past results do not indicate future results.
A drop alone has not been a reliable reason. Since 1955 the S&P 500 first closed 10% below a record 24 times; it was higher a year later 16 times, but 11 of the 24 drops went on to become bear markets. The decision depends on when you need the money and whether a deeper fall is likely, not on the drop itself.
From January 2000 to December 2025, $10,000 left in the S&P 500 grew to about $47,000 before dividends. Missing just the 10 best days cut that to about $21,000, and 24 of the 25 best days since 1955 came while the index was already 10% or more below its high.
Since 1955, 11 of the 24 first 10% drops, 46%, went on to a fall of 20% or more. The other 13 stopped short, and in every one of them the index was higher 12 months later.
Price alone cannot tell you. RegimeSignal's Bear, Correction and Pullback signals read the conditions that came before larger declines and email subscribers the day one fires. As of November 16, 2026, none was firing.
No. RegimeSignal publishes market research and signals about the S&P 500, not advice for any individual. What to do with your own money depends on your goals, timeline and taxes.
More studies: stock market correction or bear market? · is a bear market coming? · when to buy stocks · is the stock market overvalued? · all research.
Try RegimeSignal free for 15 minutes →No signup · no credit card · no download. Then a 7-day free trial; plans from $29 a month. See every plan on regimesignalai.com.Important disclosures. Published by Cronus Market Intelligence, LLC for general information and education only. Impersonal research that does not consider any reader’s objectives, finances or needs; not an offer, solicitation or recommendation to buy, sell or hold any security. Cronus is not a registered investment adviser or broker-dealer. Historical studies are prepared with the benefit of hindsight; the definitions used (a first close 10% below a record, a new episode only after a new record, a bear market as a fall of 20% measured close to close, price returns without dividends) were chosen by us and other choices give different results. Signal figures describe how the signals performed on historical data and in validation; they are not a guarantee of future accuracy, and a signal can miss or fire falsely. Data come from third-party sources believed reliable but not guaranteed. Investing involves risk, including loss of all money invested. Past performance, actual or hypothetical, does not indicate future results. S&P 500 is a registered trademark of S&P Dow Jones Indices LLC, which does not sponsor or endorse this research; an index cannot be invested in directly. RegimeSignal is a trademark of Cronus Market Intelligence, LLC. © 2026 Cronus Market Intelligence, LLC.
RegimeSignal™ · Cronus Market Intelligence, LLC · Santa Barbara, California