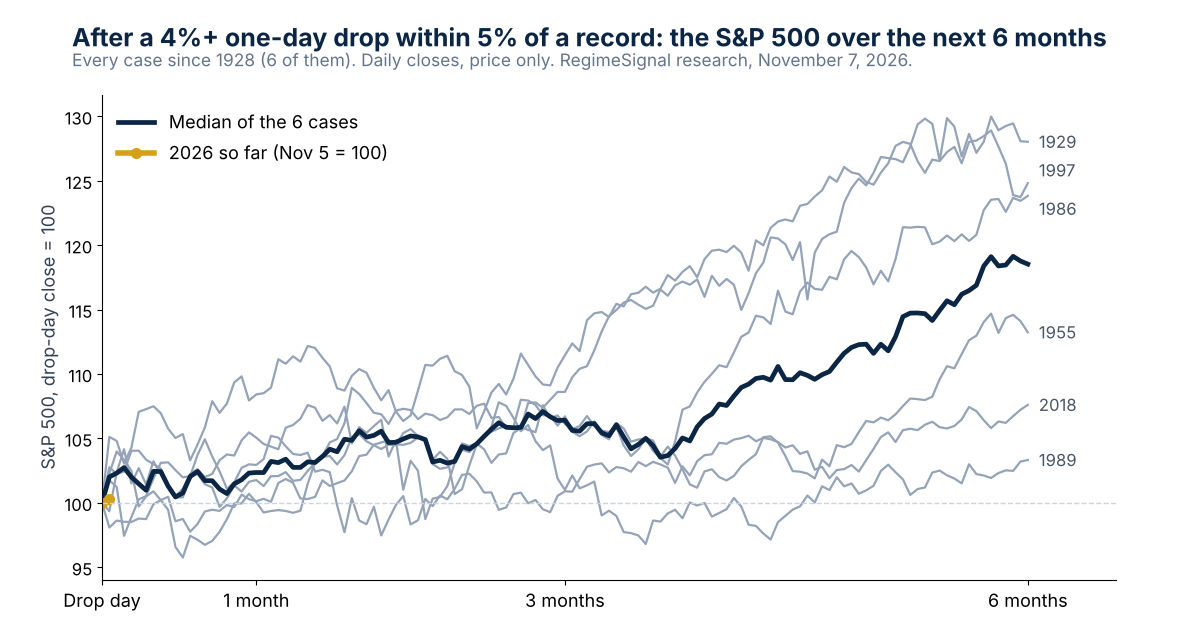
Thursday’s drop took the S&P 500 from 7,688.62 to 7,353.73, its largest one-day loss since April 2025. It came with the index just 1.7% below its record close of 7,818.93, set on October 6. On Friday it rose 0.3% to 7,376.86, leaving it 5.7% below that record. Here is what we measured, and what it does and does not tell you.
We took every S&P 500 close since December 1927 and found every day the index fell 4% or more while the prior close sat within 5% of its all-time high, counting each cluster of drops once. There are six. Two are famous: the October 1989 “Friday the 13th” selloff and the October 1997 Asian crisis drop.
| Drop day (biggest drop first) | Drop | Below record before | 1 month | 3 months | 12 months | Deepest further fall, 3 months | Bear market within 12 months? |
|---|---|---|---|---|---|---|---|
| November 5, 2026 | −4.36% | −1.7% | — | — | — | — | Open |
| October 27, 1997 | −6.87% | −4.2% | +8.4% | +11.5% | +21.5% | 0.0% | No |
| September 26, 1955 | −6.62% | 0.0% | 0.0% | +6.1% | +7.4% | −4.2% | No |
| October 13, 1989 | −6.12% | −1.2% | +1.8% | +1.0% | −10.1% | −0.3% | No |
| September 11, 1986 | −4.81% | −2.7% | +0.1% | +6.7% | +34.8% | −2.2% | No |
| February 5, 2018 | −4.10% | −3.9% | +2.9% | +0.9% | +3.1% | −2.6% | No |
| March 25, 1929 | −4.07% | −2.0% | +5.1% | +8.6% | +0.2% | −1.3% | Yes, October 1929 |
| Median of the six | +2.4% | +6.4% | +5.2% | −1.8% | 1 of 6 | ||
| Any day since 1928 (about 24,600 days) | +1.0% | +2.6% | +9.6% | −3.4% | — |
Price changes from the drop-day close, dividends excluded. “Deepest further fall” is the lowest close in the next three months against the drop-day close (higher = worse; most cases barely fell further). Bear market = a close 20% or more below the record within 12 months.
Three months later the index was higher in all six cases, by a median of 6.4%, against 2.6% for an average three months. Six months later it was higher in all six, by a median of 18.5%. A year later it was higher in five. The one bear market, 1929, arrived seven months after the March drop, after the index had first rallied about 30% to its September 1929 peak. BORDERLINE With six cases, six higher out of six could happen by chance about 7% of the time, so treat this as a strong tendency, not a rule.
See today’s market call and whether our Bear signal is firing →Free 15-minute preview · no signup · no credit card · no downloadBecause most big down days come after the damage is done. Since 1928 the S&P 500 has had 60 separate 4% drops. Only six started near a record. The median one came with the index already 46% below its high, in 1929 to 1940, 1987, 2001 to 2002 and 2008 to 2009. Since 1950 the median was 15% below the high. A 4% day inside a falling market is a symptom of a bear market; a 4% day near a record has usually been a shock to a market that was otherwise healthy.
The same holds with a lower bar. Since 1950 there were 17 drops of 3% or more within 5% of a record. The index was higher six months later in 16 of them (median +6.4%) and a bear market followed within a year only once, in February 2020, when the pandemic hit. SIGNIFICANT Sixteen of 17 higher at six months, against 71% for any day, would happen by chance about 2% of the time.
Yes. On November 6, 163 of 498 S&P 500 members (32.7%) closed 20% or more below their own 52-week high, which is the usual definition of a bear market for a single stock. 57% were 10% or more below. The median stock was 12% off its high while the index was 5.7% off. Technology is the epicenter:
| Sector (worst first) | Share of stocks 20%+ below their 52-week high | Stocks |
|---|---|---|
| Information Technology | 68.9% | 74 |
| Communication Services | 52.4% | 21 |
| Consumer Discretionary | 40.4% | 47 |
| Industrials | 38.3% | 81 |
| Materials | 36.0% | 25 |
| Energy | 33.3% | 21 |
| Utilities | 19.4% | 31 |
| Consumer Staples | 18.8% | 32 |
| Financials | 14.5% | 76 |
| Health Care | 13.3% | 60 |
| Real Estate | 13.3% | 30 |
| All S&P 500 | 32.7% | 498 |
Has weak breadth near a high warned of a bear market before? Mostly not. In weekly data from 1997 to 2025, when the index was within 5% of its high and this share was in its top tenth (27% or more), the S&P 500 rose 2.5% over the next three months on average (93 weeks, higher 67% of the time) against 1.9% in other near-high weeks. Nine earlier episodes all saw the index higher a year later. The exception that matters is 1999 to 2000: the share passed 50%, the index made its dot-com top in March 2000, and a bear market followed. NOT STATISTICALLY SIGNIFICANT as a timing tool; it tells you the rally is narrow, not when it ends.
As of the November 6 close, none of RegimeSignal’s four warning signals (Bear, Correction, Pullback and Recovery) was firing. The Bear signal looks for the conditions that have preceded bear markets, in the economy, credit and the market itself, rather than reacting to a single day. It has 86% prediction accuracy when it fires and predicted 8 out 8 bear markets since 1950. Our separate read of the bull market’s momentum had already cooled: we downgraded it from Bull Strengthening to Bull Steady on October 18, 2026, three weeks before Thursday’s drop. You can see the live call, updated every trading day, on RegimeSignal, and the full weekly read in our free Weekly Market Outlook (PDF).
“A 4% day means a crash is starting.” Not near a record: one of six. “Weak breadth predicts the top.” It has been early by months, or wrong. “The first week tells you.” The week after was mixed (higher in four of six) and the median further fall in three months was under 2%, so the next few days are a poor guide. And six cases are six cases: the next one can be the 1929 kind.
S&P 500 daily closes from December 30, 1927 to November 6, 2026 (Yahoo Finance ^GSPC; November 5 and 6 from the final exchange closes), price only. A drop counts if the close fell 4% or more from the prior close and the prior close was within 5% of the highest close to date; a drop within 20 trading days of an earlier one is the same episode. Forward returns are from the drop-day close over 5, 21, 63, 126 and 252 trading days. Chance figures are one-sided binomial tests against the share of all days that were higher over the same horizon. Breadth: each current S&P 500 member against its own 52-week closing high, adjusted closes; the 1997 to 2025 history uses current members only, so names that left the index are missing and past readings are understated. Signal status from the RegimeSignal live state, data through November 6, 2026.
History does not point that way. In the six times since 1928 the S&P 500 fell 4% or more in a day while within 5% of a record, it was higher three months later every time and a bear market followed within a year only once, in 1929. As of the November 6 close none of our four warning signals was firing.
It depends on where the drop happens. Of 60 such drops since 1928, 54 came after a decline was already under way, with the median one 46% below the prior record. The six that came near a record were followed by a median gain of 6.4% over three months.
Not by itself. One of the six near-record cases, March 1929, came seven months before the 1929 crash. The other five, in 1955, 1986, 1989, 1997 and 2018, were not followed by a bear market within a year.
163 of 498 members (32.7%) closed 20% or more below their 52-week high on November 6, 2026, including 68.9% of technology stocks, while the index itself was 5.7% below its record.
No single statistic tells you. Big down days and weak breadth have both been poor timers on their own. RegimeSignal's Bear signal combines economic, credit and market inputs; it predicted 8 out 8 bear markets since 1950 and is not firing now.
More studies: the midterm election and the S&P 500 · how RegimeSignal picks stocks · all research.
Try RegimeSignal free for 15 minutes →No signup · no credit card · no download. See every plan on regimesignalai.com.Important disclosures. Published by Cronus Market Intelligence, LLC for general information and education only. Impersonal research that does not consider any reader’s objectives, finances or needs; not an offer, solicitation or recommendation to buy, sell or hold any security. Cronus is not a registered investment adviser or broker-dealer. Historical studies are prepared with the benefit of hindsight; the definitions used (4%, within 5% of a record, 20 trading days) were chosen by us and other choices give different results. Signal figures describe how the signals performed on historical data and in validation; they are not a guarantee of future accuracy, and a signal can miss or fire falsely. Data come from third-party sources believed reliable but not guaranteed. Investing involves risk, including loss of all money invested. Past performance, actual or hypothetical, does not indicate future results. S&P 500 is a registered trademark of S&P Dow Jones Indices LLC, which does not sponsor or endorse this research; an index cannot be invested in directly. RegimeSignal is a trademark of Cronus Market Intelligence, LLC. © 2026 Cronus Market Intelligence, LLC.
RegimeSignal™ · Cronus Market Intelligence, LLC · Santa Barbara, California