“Buy the dip” is the standard advice at the start of every decline, including the ones that turned into bear markets. On November 13, 2026 the S&P 500 closed at 7,561.67, 3.3% off its peak, while the typical stock inside it had fallen much further. Here is what the record since 1950 shows about how far declines like this travel.
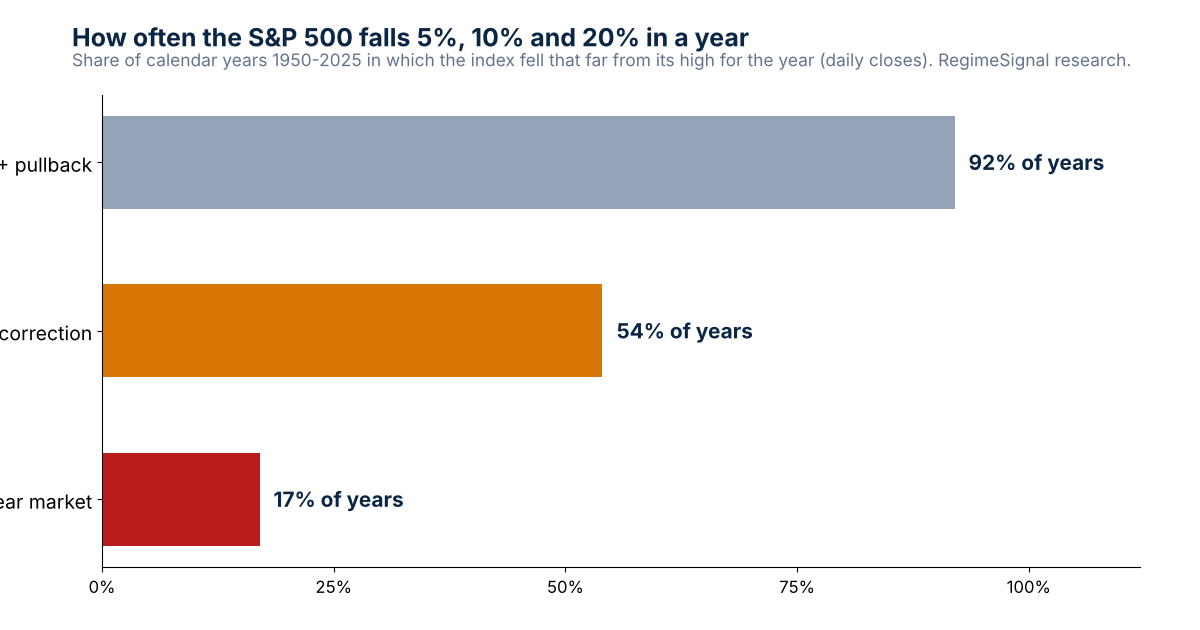
Measured from each year’s own high, the index dropped at least 5% in 92% of years, at least 10% in 54% and at least 20% in 17%. Dips are routine. What makes them dangerous is that the first few percent of a mild pullback and of a deep bear market look exactly alike.
| How far the decline went (biggest first) | Share of 5%+ declines | Average fall | Median time to the low | Median time back to the old high |
|---|---|---|---|---|
| Bear market (20% or more) | 15% | −34.7% | about 15 months | about 2 years |
| Correction (10% to 20%) | 21% | −14.2% | about 3 months | about 7 months |
| Pullback (5% to 10%) | 64% | −6.9% | about 4 weeks | about 10 weeks |
Adverse table: deeper declines are worse and sit at the top. Price only, daily closes; times are calendar time from the high.
The gap between the rows is the whole story: a typical pullback costs about 7% and is repaired in roughly ten weeks, while a typical bear market costs about 35% and takes around two years to repair. The 2000 and 2007 bear markets each erased close to half the index.
See today’s market call and whether our warning signals are firing →Free 15-minute preview · no signup · no credit card · no downloadStock by stock, it already is. At the November 13 close 52.2% of index members were at least 10% under their 12-month highs and 29.1% were at least 20% under. The median member was off 10.5% against 3.3% for the index. Leadership groups are hurt worst, with bear-market shares of 60.8% in technology, 42.9% in communication services and 38.3% in consumer discretionary. The Nasdaq-100 sits 8.9% under its peak.
Macro conditions are not helping. The 10-year yield ended the week at 5.15% (4.86% a week before), October CPI came in at +0.4%, and annual inflation is just above 4%. Declines that start with rates and inflation moving up have more room to extend.
Not by the size of the first drop, and not by headlines. You need a separate test for each kind of decline, run on the data behind the market every day. That is how RegimeSignal works.
| RegimeSignal signal | Watches for | Right when it fired |
|---|---|---|
| Bear signal | a 20%+ decline | 86% |
| Correction signal | a 10%+ decline | 84% |
| Pullback signal | a 5%+ decline | 83% |
| Recovery signal | the turn back up | — |
Out-of-sample precision on historical and validation data; 84% on average. Walk-forward validated, PhD validated and independently audited.
The Bear signal flagged 8 out of 8 bear markets since 1950. A hypothetical study that stepped aside only when the bear or correction alerts fired, December 2000 to October 2025, finished 126% ahead of simply holding the S&P 500, and its deepest loss was −12.7% versus −50.8% for the index (pre-tax, before fees). When a signal fires, subscribers are told by email that same day.
At the November 13 close all four warning signals were quiet and the regime read bull. With so many members already in correction territory, any change will matter. The live call updates every trading day at RegimeSignal.
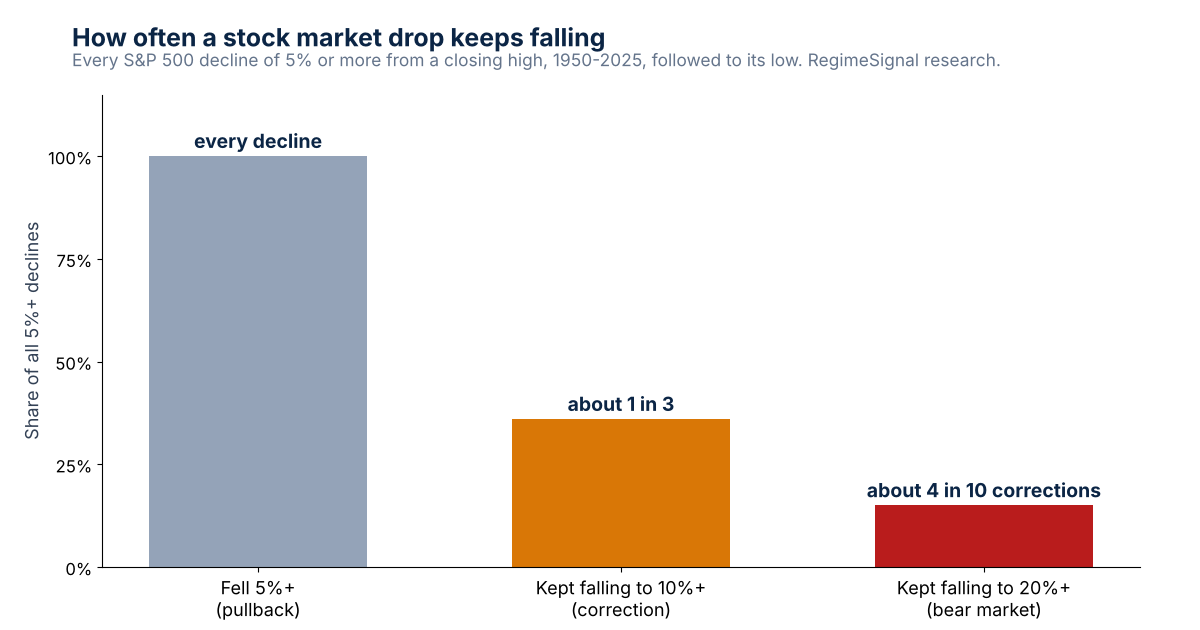
“Every dip is a buying opportunity.” About 15% of 5% declines since 1950 became bear markets. “A correction means a bear market is coming.” Six in ten corrections stopped short of 20%. “It’s only 3%, so nothing is wrong.” The index can hide a correction in most of its stocks, as it does now.
S&P 500 daily closes, January 1950 to December 2025 (Yahoo Finance ^GSPC), price only. A decline starts at a closing high, counts once it closes 5% or more below that high, and ends when the index closes at a new high; its depth is the lowest close in between. Share of years: each calendar year’s largest fall from that year’s own high. Breadth: each current S&P 500 member against its own 52-week closing high, November 13, 2026. Inflation: U.S. Bureau of Labor Statistics, October CPI. Signal accuracy is precision, how often a fired signal was right, out of sample.
A drop of 10% to 20% from a high. In 54% of calendar years since 1950 the S&P 500 fell at least 10%; declines that ended between 10% and 20% averaged 14.2% and took about seven months to regain the prior high.
Depth. A pullback is a 5% to 10% fall, a correction is 10% to 20% and a bear market is 20% or more. Since 1950 they happened in 92%, 54% and 17% of calendar years respectively.
About 4 in 10 times. Of every S&P 500 decline of 10% or more from 1950 to 2025, about 42% went on to 20% or more.
Corrections that stayed under 20% took about three months to hit bottom and about seven months to get back to the old high. Bear markets took about 15 months to bottom and about two years to recover.
The index is not: it closed November 13, 2026 3.3% below its record. But 52.2% of S&P 500 stocks were 10% or more below their highs and 29.1% were 20% or more below.
More studies: is the stock market going to crash? · why is the stock market down? · is a bear market coming? · all research.
Try RegimeSignal free for 15 minutes →No signup · no credit card · no download. Then a 7-day free trial; plans from $29 a month. See every plan on regimesignalai.com.Important disclosures. Published by Cronus Market Intelligence, LLC for general information and education only. Impersonal research that does not consider any reader’s objectives, finances or needs; not an offer, solicitation or recommendation to buy, sell or hold any security. Cronus is not a registered investment adviser or broker-dealer. Historical studies are prepared with the benefit of hindsight; the definitions used (4%, within 5% of a record, 20 trading days) were chosen by us and other choices give different results. Signal figures describe how the signals performed on historical data and in validation; they are not a guarantee of future accuracy, and a signal can miss or fire falsely. Data come from third-party sources believed reliable but not guaranteed. Investing involves risk, including loss of all money invested. Past performance, actual or hypothetical, does not indicate future results. S&P 500 is a registered trademark of S&P Dow Jones Indices LLC, which does not sponsor or endorse this research; an index cannot be invested in directly. RegimeSignal is a trademark of Cronus Market Intelligence, LLC. © 2026 Cronus Market Intelligence, LLC.
RegimeSignal™ · Cronus Market Intelligence, LLC · Santa Barbara, California