“Is the stock market overvalued?” has a frustrating answer: it depends on which yardstick you use, and even the right yardstick says more about the next ten years than the next one. We lined up five common measures as of the November 16, 2026 close, then tested what high valuations have meant for returns since 1950.
At the November 16, 2026 close the S&P 500 stood at 7,417, down 1.9% on the day and 5.2% below its October 6 record of 7,819. None of the four warning signals was firing and the market regime read bull.
| Measure, November 16, 2026 | Today | Compared with | Reads |
|---|---|---|---|
| Shiller P/E (price to 10 years of real earnings) | 39.2 | 17.4 average, 1881–2023 | expensive, 2.3 times average |
| Earnings yield vs 10-year Treasury | 3.94% vs 5.13% | stocks yield 1.2 points less than bonds | expensive versus bonds |
| Trailing P/E (last 12 months of earnings) | 25.4 | 23.7 ten-year median | somewhat expensive, 7% above |
| Forward P/E (next 12 months, FactSet, Nov 13) | 18.3 | 19.1 ten-year and 19.8 five-year averages | below its recent averages |
| Dividend yield | 1.09% | — | low; most of the return must come from price |
Live readings from RegimeSignal’s market data; forward and trailing P/E from FactSet Earnings Insight as of November 13, 2026; Shiller average from Robert Shiller’s long-run data.
The measures disagree because they use different earnings. On the last ten years of earnings, the market is near the most expensive it has ever been. On next year’s expected earnings, it looks ordinary, because analysts expect profits to rise sharply. If those forecasts come true, today’s prices are easier to defend; if they fall short, the forward figure is understating how expensive stocks are.
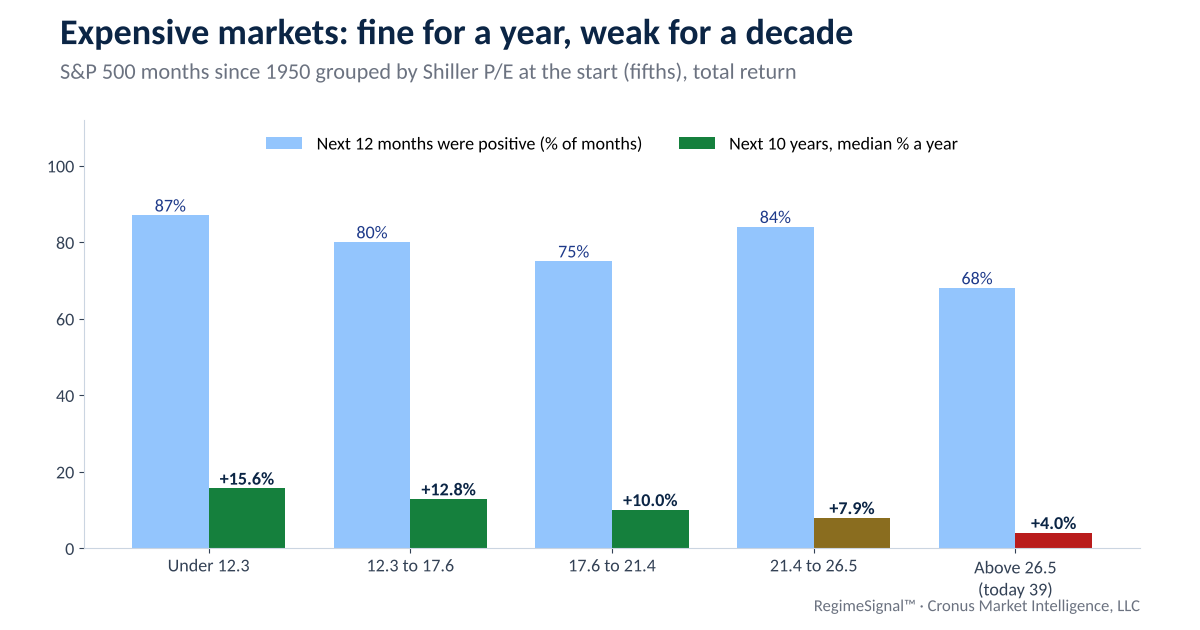
We split every month since 1950 into five equal groups by its Shiller P/E at the start and measured the S&P 500’s total return (dividends included) afterward.
| Shiller P/E at the start (biggest 10-year result first) | Next 10 years, median a year | Next 12 months were positive | Next 12 months, median |
|---|---|---|---|
| Under 12.3 | +15.6% | 87% | +18.5% |
| 12.3 to 17.6 | +12.8% | 80% | +17.9% |
| 17.6 to 21.4 | +10.0% | 75% | +9.9% |
| 21.4 to 26.5 | +7.9% | 84% | +11.7% |
| Above 26.5 (today: 39.2) | +4.0% | 68% | +10.2% |
Monthly data, January 1950 to September 2023 (Shiller), total return; months overlap, so the counts overstate independent evidence.
Two things are true at once. The most expensive fifth of months was followed by the weakest decades by a wide margin: about 4% a year against 15.6% from the cheapest fifth. But over the following twelve months, expensive markets still rose more than two-thirds of the time, with a median gain of about 10%. Valuation has been a poor guide to the next year.
At 25.4 times trailing earnings, the S&P 500 earns about 3.9% of its price each year, less than the 5.13% paid by a 10-year Treasury. Since 1950, stocks yielded less than the 10-year Treasury in 354 of 882 months (40%, Shiller data through mid-2023).
| Starting point, months since 1950 | Next 10 years, median a year | 10 years lost money | Next 12 months, median | 12 months lost money |
|---|---|---|---|---|
| Stocks yielded more than the 10-year Treasury (528) | +11.8% | 0% | +13.8% | 19% |
| Stocks yielded less than the 10-year Treasury (354) | +10.2% | 6% | +13.2% | 26% |
Total return, dividends included, before inflation. The 10-year count for the second row is from the months with ten full years of data.
The gap has been a mild warning, not a verdict. Most of those months came between 1980 and 2003, when Treasury yields were falling from very high levels and lifted stocks along with bonds. That tailwind is not guaranteed today.
Longer than most people expect. Here is every stretch since 1928 when the Shiller P/E stayed above 25 for a year or more.
| Shiller P/E above 25 (biggest gain first) | Months | S&P 500 during the stretch |
|---|---|---|
| April 2020 to today (see note) | 79 | +168% |
| March 2016 to February 2020 | 48 | +62% |
| August 1996 to June 2002 | 71 | +53% |
| November 1928 to October 1929 | 12 | +21% |
| September 2003 to September 2005 | 25 | +20% |
| August 2006 to December 2007 | 17 | +15% |
| June 2014 to August 2015 | 15 | +5% |
Monthly average prices from the first to the last month of each stretch (Shiller data); the current stretch is measured from the April 2020 monthly average to the November 16, 2026 close, with the Shiller P/E above 25 every month through September 2023 in Shiller’s data and at 39.2 in our live reading today.
Four of the six completed stretches ended in or right before a bear market: 1929, 2000 to 2002, 2007 and 2020. Valuation set how far those falls could go. It did not say when they would start.
RegimeSignal’s signals do not ask whether stocks are expensive. They read the conditions that came before declines started and fire when those conditions line up.
| RegimeSignal signal | Watches for | Right when it fired |
|---|---|---|
| Bear signal | a 20%+ decline | 86% |
| Correction signal | a 10%+ decline | 84% |
| Pullback signal | a 5%+ decline | 83% |
| Recovery signal | the turn back up | — |
Out-of-sample precision on historical and validation data; 84% on average. Walk-forward validated, PhD validated and independently audited.
The Bear signal flagged 8 out of 8 bear markets since 1950. A hypothetical study that stepped aside only when the bear or correction alerts fired, December 2000 to October 2025, finished 126% ahead of simply holding the S&P 500, with a deepest loss of −12.7% versus −50.8% for the index (pre-tax, before fees). As of the November 16, 2026 close, with the Shiller P/E at 39.2, none of the four was firing.
See today’s market call and whether our warning signals are firing →Free 15-minute preview · no signup · no credit card · no downloadShiller P/E, earnings, dividends and 10-year Treasury yields: Robert Shiller’s monthly long-run S&P data (earnings through June 2023, yields through September 2023). Fifths are cut on months since 1950. Returns are total returns with dividends reinvested monthly, before inflation, every month as a separate start, so periods overlap. Today’s readings come from RegimeSignal’s live market data and FactSet Earnings Insight (November 13, 2026). Past results do not indicate future results.
On long-run measures, yes: the Shiller P/E is 39.2, about 2.3 times its long-run average of 17.4, and stocks yield 3.9% against 5.13% on the 10-year Treasury. On next year's expected earnings it looks closer to normal, at 18.3 times versus a 10-year average of 19.1 (FactSet, November 13, 2026).
Not on its own. Since 1950, months in the most expensive fifth by Shiller P/E were followed by a positive next 12 months 68% of the time. The bigger effect has been on the next decade, with median returns of about 4% a year versus 15.6% from the cheapest fifth.
For years. In Shiller's data the ratio was above 25 every month from April 2020 through September 2023, it reads 39.2 today, and the S&P 500 has risen about 168% since April 2020. The 1996 to 2002 stretch lasted 71 months.
No single one. The Shiller P/E has the strongest link to 10-year returns; the forward P/E depends on earnings forecasts; the earnings yield versus bonds shows how stocks compare with a safe alternative. They currently disagree, which is why we show them side by side.
Valuation sets the stakes, not the timing. RegimeSignal's Bear, Correction and Pullback signals are built to warn before declines begin. As of November 16, 2026, none was firing.
More studies: the Shiller P/E above 30 · is the stock market going to crash? · should I sell my stocks? · when to buy stocks · all research.
Try RegimeSignal free for 15 minutes →No signup · no credit card · no download. Then a 7-day free trial; plans from $29 a month. See every plan on regimesignalai.com.Important disclosures. Published by Cronus Market Intelligence, LLC for general information and education only. Impersonal research that does not consider any reader’s objectives, finances or needs; not an offer, solicitation or recommendation to buy, sell or hold any security. Cronus is not a registered investment adviser or broker-dealer. Historical studies are prepared with the benefit of hindsight; the definitions used (fifths of months by Shiller P/E since 1950, trailing earnings yield against the 10-year Treasury, stretches of a Shiller P/E above 25 lasting a year or more) were chosen by us and other choices give different results. Signal figures describe how the signals performed on historical data and in validation; they are not a guarantee of future accuracy, and a signal can miss or fire falsely. Data come from third-party sources believed reliable but not guaranteed. Investing involves risk, including loss of all money invested. Past performance, actual or hypothetical, does not indicate future results. S&P 500 is a registered trademark of S&P Dow Jones Indices LLC, which does not sponsor or endorse this research; an index cannot be invested in directly. RegimeSignal is a trademark of Cronus Market Intelligence, LLC. © 2026 Cronus Market Intelligence, LLC.
RegimeSignal™ · Cronus Market Intelligence, LLC · Santa Barbara, California