The Shiller P/E, also called the CAPE ratio, divides the S&P 500 by its average inflation-adjusted earnings over the previous ten years. Using ten years smooths out booms and recessions, which is why long-term investors watch it more closely than the ordinary P/E.
From 1881 through 2023 it averaged 17.4 (median 16.5). This week our platform’s live reading is 39.95, about 2.3 times that average. That is close to the highest readings on record; the all-time peak was 44.2 in December 1999, at the top of the dot-com bubble.
We took every month since 1881 and grouped them by the Shiller P/E at the start, then measured what the S&P 500 did next. The pattern is clear: the higher the starting value, the weaker the next ten years.
| Shiller P/E at the start (months since 1881) | Next 10 years, median per year | Next 10 years were negative |
|---|---|---|
| Under 10 (231 months) | +10.4% | 11% |
| 10 to 15 (460) | +5.9% | 17% |
| 25 to 30 (146) | +5.6% | 10% |
| 20 to 25 (261) | +4.3% | 21% |
| 15 to 20 (513) | +3.7% | 23% |
| Above 30 (57 with ten years of data) | −0.6% | 53% |
S&P 500 price return, dividends not included. Months overlap, and above 30 there are only a handful of separate episodes, so treat the last row as a strong tendency rather than a law.
Over the next twelve months the gap almost disappears: a median gain of 5.9% from above 30 versus 7.3% across all months, with a loss 42% of the time versus 35%. A high CAPE weighs on the next decade far more than on the next year.
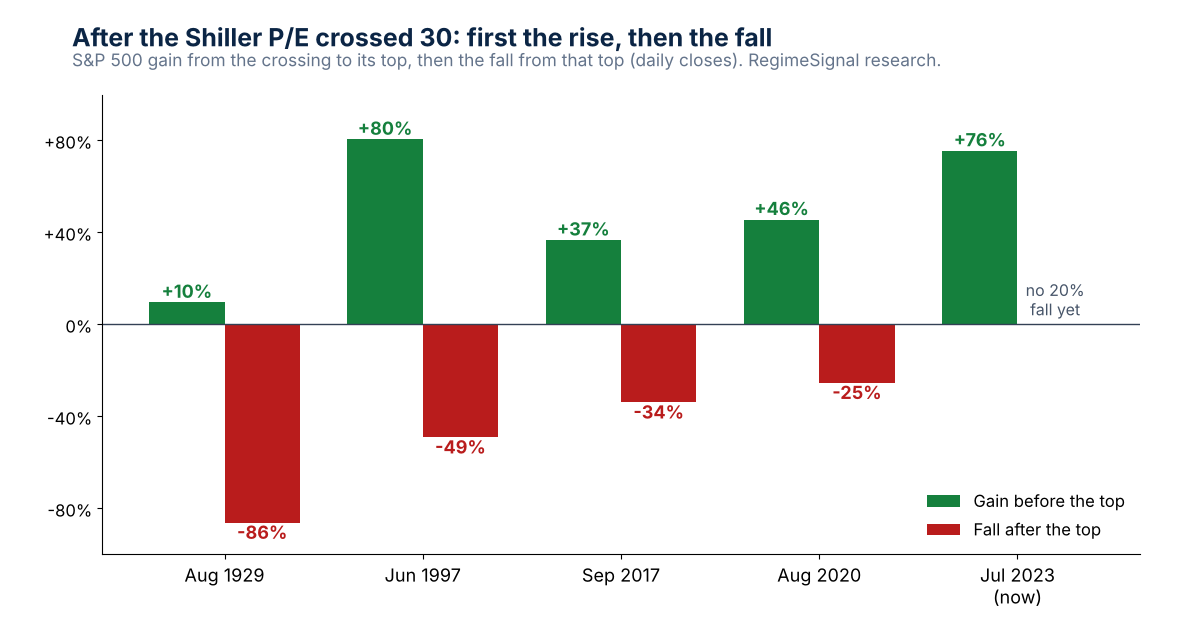
| First month above 30 | S&P 500 gain to the top | Months to the top | Fall from the top |
|---|---|---|---|
| June 1997 | +80.5% | 33 | −49.1% (low Oct 2002) |
| July 2023 (current) | +75.5% so far | 40+ | none of 20% yet; closest −18.9% (Apr 2025) |
| August 2020 | +45.6% | 17 | −25.4% (low Oct 2022) |
| September 2017 | +36.7% | 29 | −33.9% (low Mar 2020) |
| August 1929 | +9.6% | 1 | −86.2% (low Jun 1932) |
Gain to the top: from the first trading day of the crossing month to the closing high that came before the next fall of 20% or more. In the 2017 episode the late-2018 slide reached −19.8% on a closing basis, just short of a bear market, so the top that counts is February 2020.
Two lessons sit side by side. Every completed episode ended in a fall of at least 25%, so the warning has been worth taking seriously. But anyone who sold the day the ratio crossed 30 usually missed a large rally first: 80% in the late 1990s, 46% after 2020, and so far 75% in this episode.
See today’s market call and whether our warning signals are firing →Free 15-minute preview · no signup · no credit card · no downloadA high Shiller P/E says prices are stretched relative to earnings. It says nothing about the trigger. The 1929 top came a month after the crossing; the 2000 top came almost three years after it. In between, rising earnings, falling rates or plain enthusiasm can carry prices much further.
That gap between “expensive” and “falling” is exactly what RegimeSignal is built for. Its signals do not ask whether stocks are expensive; they read the conditions that have come before declines started, and fire when those conditions line up.
| RegimeSignal signal | Watches for | Right when it fired |
|---|---|---|
| Bear signal | a 20%+ decline | 86% |
| Correction signal | a 10%+ decline | 84% |
| Pullback signal | a 5%+ decline | 83% |
| Recovery signal | the turn back up | — |
Out-of-sample precision on historical and validation data; 84% on average. Walk-forward validated, PhD validated and independently audited.
The Bear signal flagged 8 out of 8 bear markets since 1950. A hypothetical study that stepped aside only when the bear or correction alerts fired, December 2000 to October 2025, finished 126% ahead of simply holding the S&P 500, and its deepest loss was −12.7% versus −50.8% for the index (pre-tax, before fees). When a signal fires, subscribers are told by email that same day.
At the November 13, 2026 close, none of the four warning signals was firing and the market regime read bull, even with the Shiller P/E near 40. Subscribers get an email the day that changes. The live readings refresh each trading day at regimesignalai.com.
Shiller P/E: monthly values 1881 to September 2023 from Robert Shiller’s long-run S&P data (ten-year average real earnings); the current 39.95 is RegimeSignal’s live reading. Return tables: monthly average S&P 500 prices, price return only, every month as a separate start, so periods overlap. Episode table: S&P 500 daily closes from Yahoo Finance (^GSPC), measured from the first trading day of the month the ratio first closed above 30 after a bear market ended; a fall is measured close to close from the highest close before it. Past results do not indicate future results.
It is the S&P 500 price divided by the average of the last ten years of inflation-adjusted earnings, also called the CAPE ratio. From 1881 through 2023 it averaged 17.4.
RegimeSignal's live reading this week is 39.95, about 2.3 times the long-run average and close to the record of 44.2 set in December 1999.
Not on its own. After each earlier crossing above 30 the S&P 500 kept rising first, by 10% to 80%, for one month to nearly three years before it topped. Every completed episode then ended with a fall of 25% to 86%.
Since 1881, months that started above 30 were followed by a median price return of -0.6% a year over the next ten years, versus +4.7% across all months, and the ten years were negative 53% of the time.
Valuation sets how far a fall can go, not when it starts. RegimeSignal's Bear, Correction and Pullback signals are built to warn before declines begin. As of November 13, 2026, none of them was firing.
More studies: is the stock market going to crash? · stock market correction or bear market? · is a bear market coming? · all research.
Try RegimeSignal free for 15 minutes →No signup · no credit card · no download. Then a 7-day free trial; plans from $29 a month. See every plan on regimesignalai.com.Important disclosures. Published by Cronus Market Intelligence, LLC for general information and education only. Impersonal research that does not consider any reader’s objectives, finances or needs; not an offer, solicitation or recommendation to buy, sell or hold any security. Cronus is not a registered investment adviser or broker-dealer. Historical studies are prepared with the benefit of hindsight; the definitions used (a Shiller P/E above 30, a new episode after a bear market ends, a fall of 20% measured close to close) were chosen by us and other choices give different results. Signal figures describe how the signals performed on historical data and in validation; they are not a guarantee of future accuracy, and a signal can miss or fire falsely. Data come from third-party sources believed reliable but not guaranteed. Investing involves risk, including loss of all money invested. Past performance, actual or hypothetical, does not indicate future results. S&P 500 is a registered trademark of S&P Dow Jones Indices LLC, which does not sponsor or endorse this research; an index cannot be invested in directly. RegimeSignal is a trademark of Cronus Market Intelligence, LLC. © 2026 Cronus Market Intelligence, LLC.
RegimeSignal™ · Cronus Market Intelligence, LLC · Santa Barbara, California