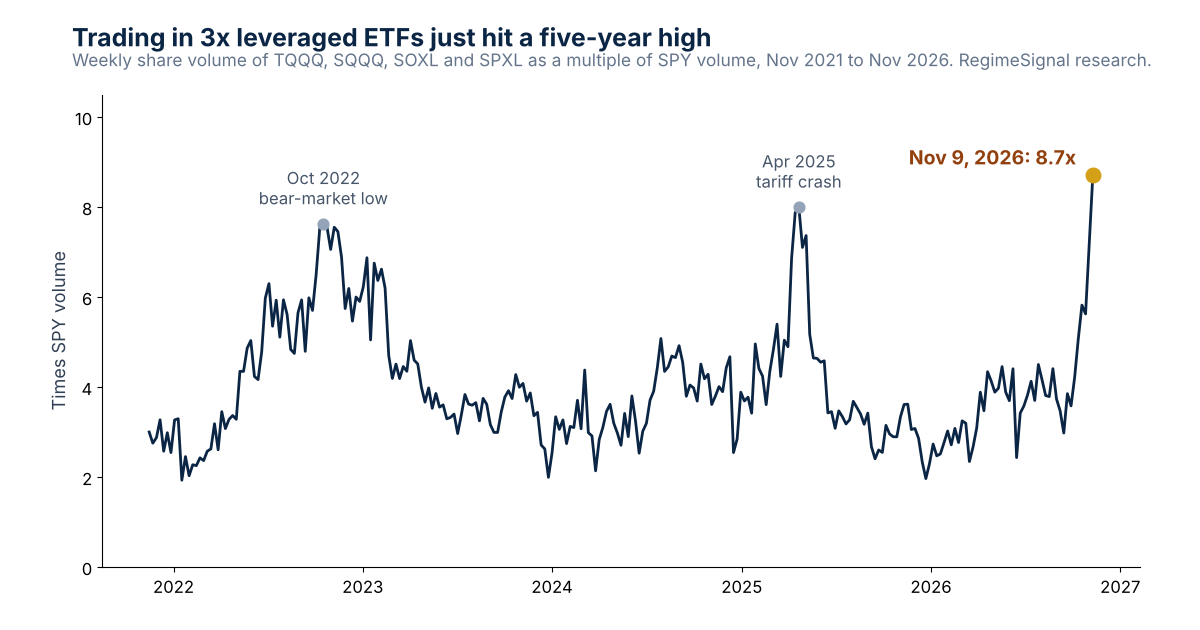
Add up the shares that changed hands in TQQQ, SQQQ, SOXL and SPXL during the week of November 9, 2026, and you get 8.7 times the shares traded in SPY, the plain S&P 500 index fund. Back in mid-September that multiple stood at 3.0, so it has close to tripled in about eight weeks.
Each of these funds aims for three times the daily move of its index, up or down, and resets every session, which erodes value when markets chop sideways. Heavy volume in them is a sign of short-term speculation rather than long-term investing.
Judged by the index, no: it ended Friday, November 13, at 7,561.67, off 0.40% for the day and 3.3% from its peak. Judged by its members, the picture is darker. Our daily pricing of 498 constituents showed this at that close:
| Measure, November 13, 2026 | Reading |
|---|---|
| S&P 500 stocks 20% or more below their 12-month high (a bear market) | 29.1% (145 stocks) |
| S&P 500 stocks 10% or more below (a correction) | 52.2% |
| Typical (median) stock below its high | −10.5% |
| Technology stocks in a bear market | 60.8% |
| The S&P 500 index below its record | −3.3% |
Each stock against its own 52-week closing high. The index is held up by a handful of giant companies; the typical stock is down more than three times as much.
Across 261 weeks of data, the previous highs were 7.6 (week of October 17, 2022) and 8.0 (week of April 21, 2025). Both arrived just after a steep decline had bottomed: the 2022 bear-market low on October 12, and the April 8, 2025 low that capped a near-19% slide over seven weeks. The difference now is that the record comes with the index barely 3% below its high.
Most of the surge came from SOXL, the 3x semiconductor fund: over 1.1 billion shares in a single week, more than triple its typical September week. Semiconductors have already been through a crash of their own. SOXX, the iShares chip ETF, dropped 33% between its October 5 peak and November 5 trough; SOXL gave up 75% over that span and, despite a rebound, finished November 13 down 64.5% from its October level. Tech was the weakest sector again on Friday (−2.01%), and the 10-year Treasury yield rose to 5.15% from 4.86% the prior Friday.
See today’s market call and whether our warning signals are firing →Free 15-minute preview · no signup · no credit card · no downloadNot from one statistic. A crash is usually a bear market that was already building underneath, then broke in days. What helps is a system that reads the economy, credit and the market together and has been tested against decades of history. That is what we built.
| RegimeSignal signal | Watches for | Right when it fired |
|---|---|---|
| Bear signal | a 20%+ decline | 86% |
| Correction signal | a 10%+ decline | 84% |
| Pullback signal | a 5%+ decline | 83% |
| Recovery signal | the turn back up | — |
Out-of-sample precision on historical and validation data; 84% on average. Walk-forward validated, PhD validated and independently audited.
The Bear signal flagged 8 out of 8 bear markets since 1950. A hypothetical study that stepped aside only when the bear or correction alerts fired, December 2000 to October 2025, finished 126% ahead of simply holding the S&P 500, and its deepest loss was −12.7% versus −50.8% for the index (pre-tax, before fees). When a signal fires, subscribers are told by email that same day.
Where do the signals stand? As of the November 13 close, none of the four warning signals was firing and the market was still in a bull regime. Our Nasdaq Market Call has read Underperform since November 5. See the live call, updated every trading day, at RegimeSignal.
“Record leveraged trading means a crash is next.” Not on its own. In both earlier cases the record came right after the low, when the selling was ending, so it is a measure of how much risk is in the market, not a timing tool. NOT A TIMING SIGNAL “The index is fine, so the market is fine.” With 29% of stocks in bear markets, the index is resting on fewer and fewer names. “Weak breadth means the top is in.” Our earlier study found weak breadth near a high has usually been early, by months, or wrong.
Leveraged ETF volume: weekly share volume of TQQQ, SQQQ, SOXL and SPXL divided by SPY weekly volume, Yahoo Finance, November 2021 to the week of November 9, 2026 (261 weeks). Chip moves: iShares Semiconductor ETF (SOXX) and SOXL daily closes. Breadth: each current S&P 500 member against its own 52-week closing high, Cronus Market Intelligence daily data, November 13, 2026. The April 2025 decline is the S&P 500 from its February 19 close to its April 8 close. Signal status from the RegimeSignal live state, data through November 13, 2026.
No one can say for certain. The S&P 500 closed November 13, 2026 just 3.3% below its record, but 29% of its stocks are already 20% or more below their highs, chip stocks fell 33% in a month and trading in 3x leveraged ETFs hit a five-year high. None of RegimeSignal's four warning signals was firing at that close.
The index is not: the S&P 500 fell 0.40% on November 13, 2026 and sits 3.3% below its record. Many stocks are: 145 of 498 S&P 500 stocks are in their own bear market, including 60.8% of technology stocks.
Not from a single statistic. RegimeSignal's Bear signal reads economic, credit and market inputs together; it predicted 8 out of 8 bear markets since 1950 and is 86% accurate when it fires, on historical and validation data.
It shows how much speculative risk is in the market. In the week of November 9, 2026, TQQQ, SQQQ, SOXL and SPXL traded 8.7 times SPY volume, the highest in at least five years. The two earlier peaks, October 2022 and April 2025, came right after sharp sell-offs hit bottom.
145 of 498 (29.1%) closed 20% or more below their 52-week high on November 13, 2026, and 52.2% were 10% or more below.
More studies: stock market correction or bear market? · why is the stock market down? · is a bear market coming? · all research.
Try RegimeSignal free for 15 minutes →No signup · no credit card · no download. Then a 7-day free trial; plans from $29 a month. See every plan on regimesignalai.com.Important disclosures. Published by Cronus Market Intelligence, LLC for general information and education only. Impersonal research that does not consider any reader’s objectives, finances or needs; not an offer, solicitation or recommendation to buy, sell or hold any security. Cronus is not a registered investment adviser or broker-dealer. Historical studies are prepared with the benefit of hindsight; the definitions used (4%, within 5% of a record, 20 trading days) were chosen by us and other choices give different results. Signal figures describe how the signals performed on historical data and in validation; they are not a guarantee of future accuracy, and a signal can miss or fire falsely. Data come from third-party sources believed reliable but not guaranteed. Investing involves risk, including loss of all money invested. Past performance, actual or hypothetical, does not indicate future results. S&P 500 is a registered trademark of S&P Dow Jones Indices LLC, which does not sponsor or endorse this research; an index cannot be invested in directly. RegimeSignal is a trademark of Cronus Market Intelligence, LLC. © 2026 Cronus Market Intelligence, LLC.
RegimeSignal™ · Cronus Market Intelligence, LLC · Santa Barbara, California