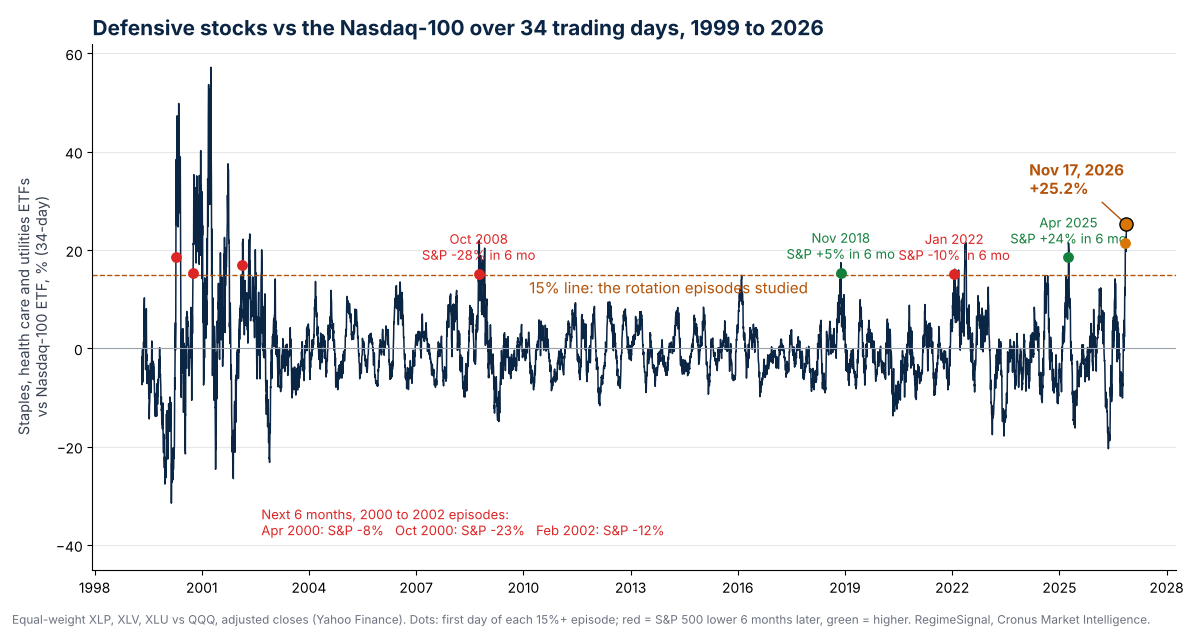
A widely shared Morgan Stanley note this week called it the sharpest defensive rotation in 25 years: consumer staples, health care and utilities have left the Nasdaq-100 far behind since October 1, and staples are at a record high. We measured it ourselves on daily fund prices back to 1999, then tested what the stock market did after every earlier rotation this sharp.
At the November 17, 2026 close the S&P 500 stood at 7,341, 6.1% below its October 6 record of 7,819. The Pullback and Correction signals were firing, the Bear signal was not.
From the September 30 close to the November 17 close, 34 trading days, the three defensive sector funds all rose while technology fell hard.
| Fund, Sep 30 to Nov 17, 2026 (biggest gain first) | Return |
|---|---|
| Consumer staples (XLP), record close Nov 16 | +13.5% |
| Utilities (XLU) | +10.1% |
| Health care (XLV) | +10.0% |
| Defensive average (equal weight) | +11.2% |
| S&P 500 (SPY) | −4.0% |
| Nasdaq-100 (QQQ) | −11.2% |
| Technology (XLK), worst | −16.6% |
Total returns from adjusted closes (dividends included). Defensives vs the Nasdaq-100 = (1 + defensive average) ÷ (1 + Nasdaq-100) − 1 = +25.2%. Morgan Stanley’s 26% was measured on its own basis and date.
Measured the same way on every day since April 1999, today’s gap is higher than 98.5% of them. Every reading above it came in 2000 and 2001, as the dot-com bubble burst; the last was October 3, 2001. So “the sharpest in 25 years” checks out on our data.
We marked an episode the first day the gap reached 15% or more after at least three months below it. That gives 7 episodes from 1999 to 2025, plus the current one, which crossed 15% on November 5, 2026.
| Episode start (best 6 months first) | S&P off its high at start | Next 3 months | Next 6 months | Next 12 months | Deepest fall within 6 months |
|---|---|---|---|---|---|
| April 3, 2025 (tariff shock) | −12.2% | +15.4% | +24.4% | +22.6% | −7.7% |
| November 19, 2018 | −8.2% | +3.8% | +4.9% | +15.5% | −12.6% |
| April 11, 2000 | −1.8% | −0.5% | −7.6% | −22.3% | −9.6% |
| January 21, 2022 | −8.3% | −2.9% | −9.8% | −8.7% | −16.6% |
| February 21, 2002 | −29.2% | +0.5% | −12.2% | −21.5% | −26.2% |
| October 3, 2000 | −6.6% | −5.5% | −22.7% | −25.9% | −22.7% |
| October 1, 2008 | −25.8% | −22.2% | −28.1% | −11.3% | −41.7% |
| Median of the 7 episodes | −8.3% | −0.5% | −9.8% | −11.3% | −16.6% |
| All days since 1999, for comparison | +5.3% | +10.8% | −4.4% |
S&P 500 index closes (^GSPC), price only. “Deepest fall” is the lowest close in the next 126 trading days measured from the episode’s starting close; red when it reached 10% or more.
Seven episodes is a small sample, and most of them sit inside two bear markets, 2000 to 2002 and 2008, so they are not seven independent tests. Taken at face value, 5 of 7 is unlikely to be chance (about 2 in 100 if each day carried the usual 28% odds), but a few more cases could change the picture. The exception matters too: in April 2025 the rotation came at the bottom of the tariff sell-off, and the S&P 500 rose 24% over the next six months.
What the history does say: money moving this hard into staples, health care and utilities has more often been a sign that investors were right to worry than a sign the worry was overdone. It is context, not one of our signals, and we do not use it to time the market.
RegimeSignal’s Correction signal, built independently of this sector study, is firing: 56% against its 50% fire level, scored on October data. It reads the odds that the S&P 500 is in a 10% decline within about four months, and has been above its fire level every month since July. The Pullback signal (5% declines) reads 91% against its 66% fire level. The Bear signal, for 20% declines, is not firing.
Out of sample, the Correction signal was right 84% of the time it fired and the Pullback signal 83%; the Bear signal flagged 8 out of 8 bear markets since 1950. A fire raises the odds; it is not a certainty and does not say when within the window. Subscribers get an email the day a signal fires or stops.
See today’s market call and which warning signals are firing →Free 15-minute preview · no signup · no credit card · no downloadDaily adjusted closes (dividends reinvested) for the Consumer Staples (XLP), Health Care (XLV), Utilities (XLU) and Technology (XLK) Select Sector SPDR funds, the Invesco QQQ Trust (Nasdaq-100) and SPY, from Yahoo Finance, December 1998 through November 17, 2026. The defensive average is the equal-weight average of the three defensive funds’ returns over each window. The gap is (1 + defensive average) ÷ (1 + QQQ) − 1 over 34 trading days, the length of the window from September 30 to November 17, 2026, computed for every day since April 28, 1999. An episode begins the first day the gap reaches 15% after at least 63 trading days below it. Forward returns use S&P 500 index closes (^GSPC), price only: 63, 126 and 252 trading days. Results for one window length and one threshold; other choices give different results. Past results do not indicate future results.
Defensive stocks are companies whose sales hold up when the economy slows: consumer staples (food, household goods), health care and utilities. Investors often move into them when they expect weaker growth or a falling market.
From the September 30 close to November 17, 2026, the consumer staples, health care and utilities sector ETFs rose an average 11.2% while the Nasdaq-100 ETF fell 11.2%, a 25.2% gap over 34 trading days. On our data that is the widest gap since October 2001, and the staples ETF set a record close on November 16.
Not by itself, but it has been a poor sign. In the 7 earlier episodes since 1999 when defensives beat the Nasdaq-100 by 15% or more over 34 trading days, the S&P 500 was lower six months later 5 times (median -9.8%) and fell 10% or more below its starting level within six months 5 times, against 28% of all days. Seven episodes, mostly in the 2000 to 2002 and 2008 bear markets, is a small sample.
Sector rotation is money moving from one group of stocks to another, for example out of technology and into consumer staples, health care and utilities. A move toward defensives usually reflects investors expecting slower growth or more risk.
As of the November 17, 2026 close, RegimeSignal's Correction signal (56% against its 50% fire level) and Pullback signal (91% against 66%) were firing; the Bear signal was not. The Correction signal reads the odds of a 10% decline within about four months and is built independently of this sector study.
More studies: stock market correction or bear market? · is the stock market going to crash? · should I sell my stocks? · is the stock market overvalued? · all research.
Try RegimeSignal free for 15 minutes →No signup · no credit card · no download. Then a 7-day free trial; plans from $29 a month. See every plan on regimesignalai.com.Important disclosures. Published by Cronus Market Intelligence, LLC for general information and education only. Impersonal research that does not consider any reader’s objectives, finances or needs; not an offer, solicitation or recommendation to buy, sell or hold any security, sector or fund, including the funds named here. Cronus is not a registered investment adviser or broker-dealer. Historical studies are prepared with the benefit of hindsight; the definitions used (a 34-trading-day window, a 15% threshold, an equal-weight defensive average, price returns for the S&P 500) were chosen by us and other choices give different results. The Morgan Stanley observation is cited as publicly reported; our figures are our own. Signal figures describe how the signals performed on historical data and in validation; they are not a guarantee of future accuracy, and a signal can miss or fire falsely. Data come from third-party sources believed reliable but not guaranteed. Investing involves risk, including loss of all money invested. Past performance, actual or hypothetical, does not indicate future results. S&P 500 is a registered trademark of S&P Dow Jones Indices LLC; Nasdaq-100 is a registered trademark of Nasdaq, Inc.; Select Sector SPDR is a trademark of S&P Global; none sponsors or endorses this research. An index cannot be invested in directly. RegimeSignal is a trademark of Cronus Market Intelligence, LLC. © 2026 Cronus Market Intelligence, LLC.
RegimeSignal™ · Cronus Market Intelligence, LLC · Santa Barbara, California