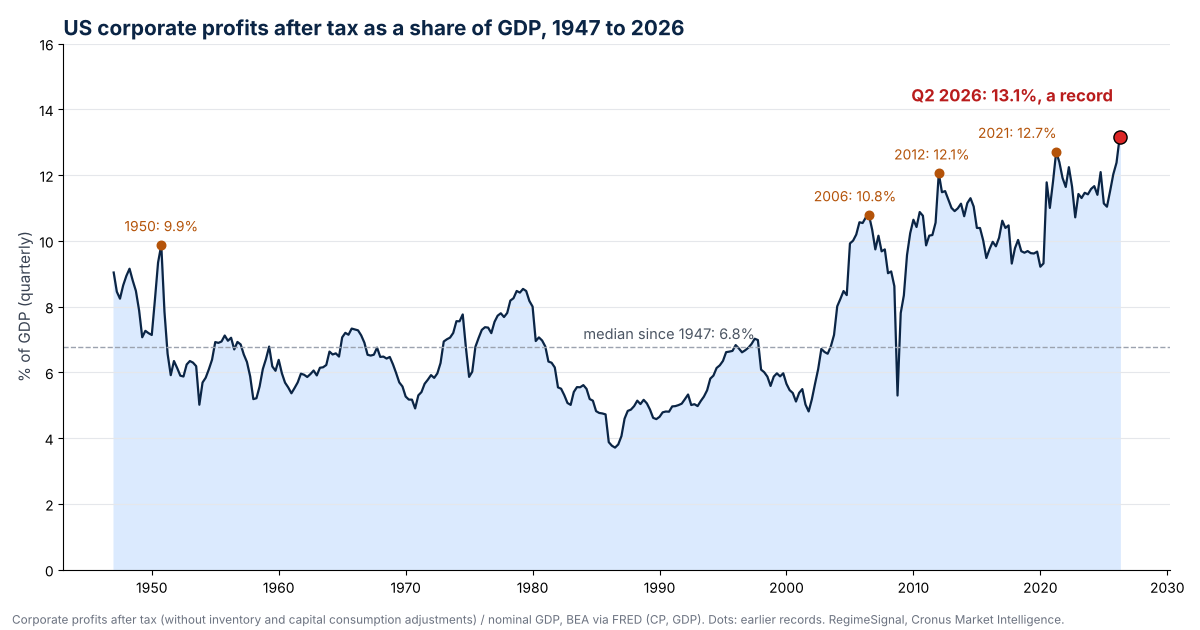
“S&P 500 earnings now account for an all-time high 8% of U.S. GDP,” ran a widely shared chart from Goldman Sachs this week, and the replies were quick: mean reversion is coming. We checked the broader, official version of the same idea, all US corporate profits after tax as a share of GDP, on government data back to 1947, and tested what the stock market did after every earlier record.
At the November 17, 2026 close the S&P 500 stood at 7,341, 6.1% below its October 6 record of 7,819. The Pullback and Correction signals were firing, the Bear signal was not.
| Profits as a share of GDP (highest first) | Share |
|---|---|
| Q2 2026, the new record | 13.1% |
| Q2 2021, the previous record | 12.7% |
| Q1 2012 | 12.1% |
| Q3 2006, before the 2008 crisis | 10.8% |
| Q4 1950 | 9.9% |
| Median, 1947 to 2026 | 6.8% |
| Low, Q3 1986 | 3.7% |
After-tax corporate profits without inventory and capital consumption adjustments (BEA series CP) divided by nominal GDP (series GDP), seasonally adjusted annual rates. Goldman’s 8% uses S&P 500 company earnings, a narrower measure; both are at records.
We matched each quarter’s profit share to the S&P 500’s price return over the following one, three, five and ten years, starting about three months after the quarter ends, when the data are actually published. Then we compared the highest fifth of readings with the lowest fifth.
| Profit share (biggest 5-year return first) | Quarters | Next year | Next 5 years, a year | 5 years positive | Next 10 years, a year |
|---|---|---|---|---|---|
| Lowest fifth (3.7% to 5.5%) | 64 | +9.9% | +10.5% | 95% | +10.6% |
| Highest fifth (9.9% to 13.1%) | 64 | +13.1% | +10.0% | 86% | +10.8% |
| All quarters since 1947 | 314 | +10.8% | +8.8% | 85% | +8.1% |
Medians. S&P 500 index closes, price only (dividends not included); five- and ten-year figures are annualized. The highest fifth has fewer completed five-year windows (44) because many of its quarters are recent.
The profit share set a new record in 11 earlier quarters, grouped in four episodes. Here is the first record of each, measured from when the data were published.
| First record of the episode (best 5 years first) | Share | Next year | Next 3 years, a year | Next 5 years, a year | Share 3 years later |
|---|---|---|---|---|---|
| Q3 1950 | 9.3% | +16.3% | +6.3% | +17.2% | −3.2 pts |
| Q2 2021 | 12.7% | −14.6% | +9.8% | +12.0% | −1.0 pts |
| Q3 2010 | 10.9% | +0.3% | +13.5% | +10.5% | +0.1 pts |
| Q1 2005 (episode ran to 2006) | 9.9% | +6.1% | +2.2% | −2.8% | −0.9 pts |
Three-year share change measured from the record quarter. Across all 11 earlier record quarters with data, the share was lower three years later 10 times, by a median of 1.6 points.
Two things stand out. The share itself does tend to come back down: after 10 of the 11 earlier record quarters it was lower three years later. That is the “mean reversion” the replies point to, and it is real, if partial. But it has not reliably dragged stocks down. Three of the four episodes saw strong five-year returns. The exception was 2005 to 2006, when record profits came just before the 2008 financial crisis.
Four episodes is a small sample, and the quarters overlap heavily, so the table above is closer to four observations than to 64. The profit share has also drifted up for four decades, so “high” today means something different from “high” in 1950. This measure counts all US companies, including profits earned abroad, while GDP counts only domestic output; the S&P 500 figure Goldman cites is narrower again. None of this is one of our signals.
RegimeSignal’s Correction signal is firing: 56% against its 50% fire level, scored on October data, and above its fire level every month since July. It reads the odds of a 10% S&P 500 decline within about four months. The Pullback signal (5% declines) reads 91% against 66%. The Bear signal, for 20% declines, is not firing. Out of sample, the Correction signal was right 84% of the time it fired and the Pullback signal 83%; the Bear signal flagged 8 out of 8 bear markets since 1950. A fire raises the odds; it is not a certainty.
See today’s market call and which warning signals are firing →Free 15-minute preview · no signup · no credit card · no downloadCorporate profits after tax without inventory valuation and capital consumption adjustments (CP) and nominal gross domestic product (GDP), both from the US Bureau of Economic Analysis via the Federal Reserve Bank of St. Louis (FRED), quarterly, Q1 1947 to Q2 2026. Profit share = CP ÷ GDP. Forward returns use S&P 500 index closes (^GSPC, Yahoo Finance), price only, starting 90 days after each quarter ends to allow for publication; multi-year returns are annualized. Fifths are quintiles of all 314 quarters with a starting price. A record quarter is one whose share is at or above every earlier quarter. Other definitions, such as pre-tax profits or S&P 500 earnings, give different levels. Past results do not indicate future results.
Yes. US corporate profits after tax reached 13.1% of GDP in the second quarter of 2026, the highest since the data begin in 1947. The previous record was 12.7% in the second quarter of 2021; the median since 1947 is 6.8%. A narrower measure, S&P 500 company earnings, is also reported at a record of about 8% of GDP.
Not on the record since 1947. Quarters in the highest fifth of profit share were followed by a median S&P 500 price gain of 10.0% a year over five years, against 10.5% a year for the lowest fifth. The correlation between the profit share and the next one to five years of S&P 500 returns was close to zero.
Mostly, but slowly and only partly. Three years after 10 of the 11 earlier record quarters with data, the profit share was lower, by a median of 1.6 percentage points. It has still trended up since the 1980s, and each new record has been higher than the last.
Common explanations include higher margins at large technology companies, lower interest costs and tax rates over the past two decades, and a larger share of US company earnings coming from overseas, which counts in profits but not in US GDP. Those are explanations offered by analysts, not something this study tests.
As of the November 17, 2026 close, RegimeSignal's Correction signal (56% against its 50% fire level) and Pullback signal (91% against 66%) were firing; the Bear signal was not. The signals read the odds of 10% and 5% declines within about four months; this study is separate from them.
More studies: is the stock market overvalued? · defensive stocks vs the Nasdaq · Shiller P/E above 30 · is the stock market going to crash? · all research.
Try RegimeSignal free for 15 minutes →No signup · no credit card · no download. Then a 7-day free trial; plans from $29 a month. See every plan on regimesignalai.com.Important disclosures. Published by Cronus Market Intelligence, LLC for general information and education only. Impersonal research that does not consider any reader’s objectives, finances or needs; not an offer, solicitation or recommendation to buy, sell or hold any security. Cronus is not a registered investment adviser or broker-dealer. Historical studies are prepared with the benefit of hindsight; the definitions used (after-tax profits without adjustments, a 90-day publication lag, quintiles of all quarters, price returns for the S&P 500) were chosen by us and other choices give different results. The Goldman Sachs figure is cited as publicly reported; our figures are our own. Signal figures describe how the signals performed on historical data and in validation; they are not a guarantee of future accuracy, and a signal can miss or fire falsely. Data come from third-party sources believed reliable but not guaranteed. Investing involves risk, including loss of all money invested. Past performance, actual or hypothetical, does not indicate future results. S&P 500 is a registered trademark of S&P Dow Jones Indices LLC, which does not sponsor or endorse this research; an index cannot be invested in directly. RegimeSignal is a trademark of Cronus Market Intelligence, LLC. © 2026 Cronus Market Intelligence, LLC.
RegimeSignal™ · Cronus Market Intelligence, LLC · Santa Barbara, California