Friday, November 13, 2026 ended with the S&P 500 at 7,561.67, a 0.40% loss led by a 2.01% drop in technology. For the full week the index gained 2.5% from November 6, and the VIX volatility index fell back to roughly 19 from 28 on November 5. That calm masks a backdrop that deteriorated over the same week.
| What changed (biggest first) | Reading |
|---|---|
| 10-year Treasury yield | 5.15% (4.86% a week before) |
| October consumer prices | +0.4% vs +0.3% forecast; above 4% a year |
| Chip stocks (iShares Semiconductor ETF), Oct 5 high to Nov 5 low | −33% |
| S&P 500 stocks 20% or more below their high | 29.1% |
| 3x leveraged ETF trading vs SPY, week of Nov 9 | 8.7x, a five-year high |
Higher yields reset what every stock, home and business loan is worth, and they hit the high-priced growth stocks hardest. That is why technology keeps leading the way down while the index, held up by a few giants, barely moves.
Mega-caps keep carrying the index, yields stabilize and the laggards heal. Our breadth research supports this outcome: after each of nine earlier periods since 1997 with this much internal damage near a high, the S&P 500 was up 12 months later. The caution is the 1999–2000 episode, when records kept coming for months before the dot-com peak and a roughly 50% decline.
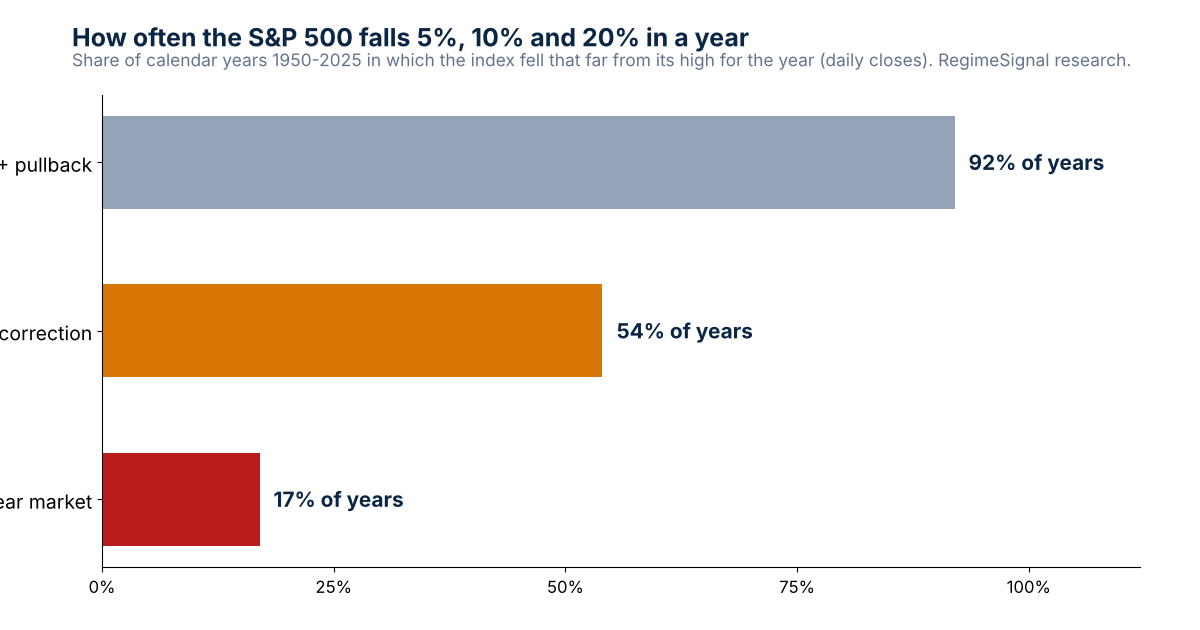
Here the index falls to meet its own members. A 10%+ drop has occurred in 54% of years since 1950; when it stopped before 20%, the average loss was about 14%, the low came about three months in, and the old high returned after about seven. Ten percent below the record is roughly 7,040 on the S&P 500.
A 20%+ decline has hit in roughly 17% of years since 1950, and about 42% of 10% declines kept going that far. The average bear market cost about 35%, needed around 15 months to find a low and about two years to recover. Climbing yields, persistent inflation and narrow leadership are familiar features of the run-up to past ones.
See today’s market call and whether our warning signals are firing →Free 15-minute preview · no signup · no credit card · no downloadAt the start, the three outcomes are indistinguishable from the headlines. Telling them apart takes separate, tested measures for each, which is how RegimeSignal is built.
| RegimeSignal signal | Watches for | Right when it fired |
|---|---|---|
| Bear signal | a 20%+ decline | 86% |
| Correction signal | a 10%+ decline | 84% |
| Pullback signal | a 5%+ decline | 83% |
| Recovery signal | the turn back up | — |
Out-of-sample precision on historical and validation data; 84% on average. Walk-forward validated, PhD validated and independently audited.
The Bear signal flagged 8 out of 8 bear markets since 1950. A hypothetical study that stepped aside only when the bear or correction alerts fired, December 2000 to October 2025, finished 126% ahead of simply holding the S&P 500, and its deepest loss was −12.7% versus −50.8% for the index (pre-tax, before fees). When a signal fires, subscribers are told by email that same day.
At the November 13 close the four warning signals were all quiet and the regime read bull; the Nasdaq Market Call, separately, has been at Underperform since November 5. The live readings refresh each trading day at RegimeSignal.
S&P 500 daily closes (Yahoo Finance ^GSPC), price only. Share of years: each calendar year 1950 to 2025, largest fall from that year’s own high. Decline odds and durations: every decline of 5% or more from a closing high, 1950 to 2025, measured to its low and to the next new high. Breadth episodes: weekly, 1997 to 2025, current members only, so past readings are understated. Breadth today: each current member against its 52-week closing high, November 13, 2026. Yields and VIX: daily closes. Inflation: U.S. Bureau of Labor Statistics, October CPI. Leveraged ETF volume: TQQQ, SQQQ, SOXL and SPXL against SPY, weekly.
On November 13, 2026 the S&P 500 fell 0.40%, led by technology (down 2.01%), as the 10-year Treasury yield closed at 5.15%, up from 4.86% a week earlier, after October consumer prices rose faster than forecast.
Rising interest rates, inflation running above 4% and a sell-off in technology and chip stocks. Chip stocks fell 33% from October 5 to November 5, 2026, and 29.1% of S&P 500 stocks are 20% or more below their highs.
Nobody knows for sure. The S&P 500 is only 3.3% below its record, but the stress underneath is real. As of November 13, 2026, none of RegimeSignal's four warning signals was firing.
Higher yields lower the value of future profits, so high-priced growth stocks usually fall most. Rising rates and sticky inflation are conditions that have come before corrections deepening into bear markets.
Measured from each calendar year's high, 1950 to 2025: at least 10% in 54% of years and at least 20% in 17%.
More studies: is the stock market going to crash? · stock market correction or bear market? · is a bear market coming? · all research.
Try RegimeSignal free for 15 minutes →No signup · no credit card · no download. Then a 7-day free trial; plans from $29 a month. See every plan on regimesignalai.com.Important disclosures. Published by Cronus Market Intelligence, LLC for general information and education only. Impersonal research that does not consider any reader’s objectives, finances or needs; not an offer, solicitation or recommendation to buy, sell or hold any security. Cronus is not a registered investment adviser or broker-dealer. Historical studies are prepared with the benefit of hindsight; the definitions used (4%, within 5% of a record, 20 trading days) were chosen by us and other choices give different results. Signal figures describe how the signals performed on historical data and in validation; they are not a guarantee of future accuracy, and a signal can miss or fire falsely. Data come from third-party sources believed reliable but not guaranteed. Investing involves risk, including loss of all money invested. Past performance, actual or hypothetical, does not indicate future results. S&P 500 is a registered trademark of S&P Dow Jones Indices LLC, which does not sponsor or endorse this research; an index cannot be invested in directly. RegimeSignal is a trademark of Cronus Market Intelligence, LLC. © 2026 Cronus Market Intelligence, LLC.
RegimeSignal™ · Cronus Market Intelligence, LLC · Santa Barbara, California