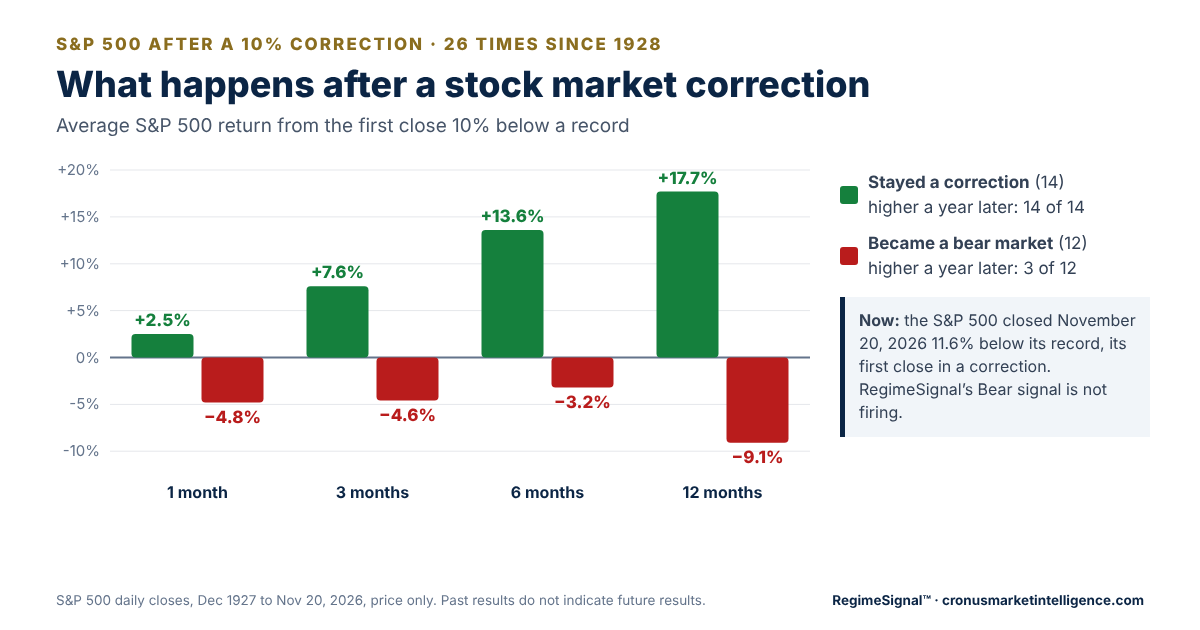
A Goldman Sachs study shared widely this week looked at 22 S&P 500 corrections since 1980 and found the index up an average of 4% three months later, rising in 73% of cases. We rebuilt the study on our own data, took it back to 1928, and split the results by how each decline ended. The average hides two very different outcomes.
| After the first 10% close (best first) | 1 month | 3 months | 6 months | 12 months | Higher a year later |
|---|---|---|---|---|---|
| Stayed a correction (14) | +2.5% | +7.6% | +13.6% | +17.7% | 14 of 14 |
| All corrections (26) | −0.9% | +1.9% | +5.8% | +5.3% | 17 of 26 |
| Became a bear market (12) | −4.8% | −4.6% | −3.2% | −9.1% | 3 of 12 |
Average S&P 500 price return 21, 63, 126 and 252 trading days after each correction’s first close 10% below a record. Medians for all 26: +2.1%, +2.5%, +5.7% and +11.4%. Since 1980 only (16 corrections): +3.1% after 3 months, higher 11 of 16 times, and a 12-month median of +14.0%, close to Goldman’s figures.
The all-corrections row is what most studies quote, and it is a blend. When the decline stopped before 20%, the index had recovered most of the loss within three months and was higher six months later every time. When it became a bear market, three months later it was lower in 9 of 12 cases, and a year later the average loss was 9%.
See today’s market call and whether the Bear signal is firing →Free 15-minute preview · no signup · no credit card · no download| How it ended (worst first) | Cases | Average total fall | Further fall after the 10% close | Time to the low | Time back to the record |
|---|---|---|---|---|---|
| Bear market (20% or more) | 12 of 26 | −39.0% | −24.9% | about 11 months | about 22 months |
| Stayed a correction (10% to 20%) | 14 of 26 | −13.9% | −2.6% | about 2 weeks | about 4 months |
Adverse table: the worst outcome sits at the top. Average total fall from the record; further fall, time to the low and time back to the record are medians from the first 10% close, in calendar time.
Corrections that stayed corrections were fast. In 6 of the 14, the first close 10% below the record was the low itself, and the median one fell only about 2.6% more. The longest took 11 months to regain the record. Bear markets were the opposite: another quarter of value lost from the 10% mark, and almost two years before a new high.
| From the record close to the low (worst first) | Cases | Average fall | Median fall | Median time, record to low |
|---|---|---|---|---|
| Became a bear market | 12 of 26 | −39.0% | −33.7% | about 16 months |
| All corrections | 26 | −25.5% | −19.9% | about 6 months |
| Stayed a correction | 14 of 26 | −13.9% | −13.1% | about 3 months |
Adverse table: the worst outcome sits at the top. Fall measured from the record close to the lowest close before the next record; time in calendar months.
A widely shared study this week put the average S&P 500 correction at about −19.5% over 3.4 months, with 35% turning into 20%+ drops. Our figures run deeper, and the reason is the starting point: we count a correction only from a record close, so shallow 10% dips inside a recovery that never made a new high are not separate events. Measured that way, 12 of 26 corrections since 1928 (11 of 24 since 1950) became bear markets. Either way the shape is the same: the typical correction that holds is over within a few months at around 13%, and the average is pulled down by the bear markets.
| Economy during the decline (best first) | Corrections | Became a bear market | Higher a year later | Median 12-month return |
|---|---|---|---|---|
| No recession | 15 | 4 of 15 | 13 of 15 | +15.5% |
| Recession | 11 | 8 of 11 | 4 of 11 | −8.5% |
Recession = an NBER-dated US recession that overlapped the decline or began within six months of its low. 12-month return measured from the first 10% close.
The four bear markets without a recession were 1962, 1966, the 1987 crash and 2022. Three corrections stayed corrections even with a recession: 1960 and both declines of 1990. The economy is not a guarantee either way, but it has been the best single dividing line.
The S&P 500 closed Friday, November 20 at 6,910.79, down 3.7% on the day and 11.6% below its October 6 record of 7,818.93. That is the 27th correction since 1928 by this measure. A 20% bear market from the record would be a close at 6,255, another 9.5% lower.
The economy does not look like the recession group so far. Unemployment is 4.1% with the Sahm rule recession indicator at 0.00, S&P 500 earnings for the third quarter are growing about 33% from a year earlier, and high-yield credit spreads are about 352 basis points, well below the stress levels seen in past bear markets. Those readings can change quickly, which is why we track them every day.
On the day a decline first closes 10% below a record, the corrections and the bear markets look exactly alike. RegimeSignal runs a separate model for each kind of decline on macro, credit, volatility and market breadth data, and fires a warning when the odds cross its trigger.
| RegimeSignal signal | Watches for | Right when it fired | Now |
|---|---|---|---|
| Bear signal | a 20%+ decline | 86% | not firing |
| Correction signal | a 10%+ decline | 84% | firing |
| Pullback signal | a 5%+ decline | 83% | firing |
| Recovery signal | the turn back up | 82% | not firing |
Out-of-sample precision on historical and validation data; 84% on average. Walk-forward validated, PhD validated and independently audited. Status as of November 21, 2026. Recovery: 82% precision on the historical walk-forward evaluation, with threshold and hyperparameters optimized on the same evaluation period (95% range 52% to 95%).
The Correction signal fired in November, before the S&P 500 reached 10% down. The Bear signal, which has called 8 out of 8 bear markets since 1950, is not firing. That is the signal that separates the top row of the first table from the bottom row.
Following the signals has paid. In a hypothetical study that stepped aside only when the Bear or Correction alerts fired, from December 2000 to October 2025, the result was 126.3% more wealth than simply holding the S&P 500, and the worst drop along the way was −12.7% against −50.8% for the index (pre-tax, before fees). Subscribers get an email the day a signal fires.
| First 10% close | How it ended | Total fall | Recession | 12 months later |
|---|---|---|---|---|
| Jun 1928 | Correction | −10.3% | no | +41.4% |
| Feb 2020 | Bear market | −33.9% | yes | +27.9% |
| Aug 1998 | Correction | −19.3% | no | +25.2% |
| Oct 1997 | Correction | −10.8% | no | +21.5% |
| Mar 2025 | Correction | −18.9% | no | +21.3% |
| Nov 2018 | Correction | −19.8% | no | +19.0% |
| Aug 1990 | Correction | −19.9% | yes | +17.6% |
| Mar 1960 | Correction | −14.0% | yes | +17.4% |
| Feb 1984 | Correction | −14.4% | no | +16.5% |
| Mar 1968 | Correction | −10.1% | no | +15.7% |
| Aug 2015 | Correction | −14.2% | no | +15.5% |
| Oct 1955 | Correction | −10.6% | no | +14.8% |
| Sep 1999 | Correction | −12.1% | no | +12.5% |
| May 1966 | Bear market | −22.2% | no | +10.3% |
| Apr 1962 | Bear market | −28.0% | no | +7.0% |
| Feb 2018 | Correction | −10.2% | no | +5.0% |
| Jan 1990 | Correction | −10.2% | yes | +4.0% |
| Feb 2022 | Bear market | −25.4% | no | −6.8% |
| Aug 1981 | Bear market | −27.1% | yes | −7.5% |
| Oct 1987 | Bear market | −33.5% | no | −7.7% |
| Nov 1956 | Bear market | −21.5% | yes | −8.5% |
| Apr 2000 | Bear market | −49.1% | yes | −12.1% |
| Apr 1973 | Bear market | −48.2% | yes | −15.9% |
| Jun 1969 | Bear market | −36.1% | yes | −21.3% |
| Oct 1929 | Bear market | −86.2% | yes | −35.8% |
| Nov 2007 | Bear market | −56.8% | yes | −39.5% |
Sorted by the 12-month return from the first close 10% below a record, best first. Total fall = record close to the lowest close before the next record. The November 2026 correction is not yet a year old and is not in this table.
“Corrections are always buying opportunities.” 12 of 26 became bear markets, and 9 of those were lower a year later. “Once it is down 10%, a crash is coming.” More than half stopped short of 20%, and 6 of 26 bottomed on the very day they first closed 10% down. “The average return after a correction tells you what to expect.” Almost no correction looked like the average: the ones that held were far better and the ones that broke were far worse.
S&P 500 daily closes from December 30, 1927 to November 20, 2026 (Yahoo Finance ^GSPC, earlier years from the same series), price only, no dividends. A record is the highest close to date. Each correction is counted once, from its first close 10% or more below the prior record until the next record close; its depth is the lowest close in between, and it is a bear market if that depth reached 20%. Because the index did not regain its 1929 high until 1954, the 1929 decline is a single episode and there are none from 1930 to 1954 by this measure. Forward returns use 21, 63, 126 and 252 trading days. Recessions are NBER business-cycle dates. The current correction, which began November 20, 2026, is not counted in the averages. Goldman Sachs’ study measures corrections differently and counts more of them; its figures are cited as published. Signal accuracy is precision, how often a fired signal was right, out of sample.
It depends on whether the decline stops before 20%. Of 26 S&P 500 corrections since 1928 (first close 10% below a record), 14 stopped short of a bear market and the index was higher 12 months later in all 14, by 17.7% on average. The other 12 became bear markets and only 3 of those were higher a year later. Across all 26, the S&P 500 was higher a year later 17 times, with a median gain of 11.4%.
Since 1928, the 26 S&P 500 corrections measured from a record close fell 25.5% on average (median 19.9%). The 14 that stayed corrections fell 13.9% on average and reached their low about 3 months after the record; the 12 that became bear markets fell 39.0% on average.
The ones that stay corrections are short. From the first close 10% below a record, the median correction since 1928 reached its low in about two weeks and was back at a record in about 4 months; the longest took 11 months. Declines that became bear markets took a median of about 11 months to reach the low and about 2 years to regain the record.
12 of 26 times since 1928. Recession was the dividing line: without a recession, 4 of 15 corrections became bear markets; with one, 8 of 11 did.
History says it has paid when the decline stayed a correction: all 14 were higher a year later. When it became a bear market, a year later the index was lower 9 times in 12. Price alone does not tell you which one you are in.
Yes. The S&P 500 closed November 20, 2026 at 6,910.79, 11.6% below its October 6 record of 7,818.93, its first close in correction territory. A 20% bear market would be a close at 6,255. RegimeSignal's Correction signal is firing; the Bear signal is not.
More studies: will the stock market crash? · stock market correction or bear market? · should I sell my stocks? · is a bear market coming? · all research.
Try RegimeSignal free for 15 minutes →No signup · no credit card · no download. Then a 7-day free trial; plans from $29 a month.Important disclosures. Published by Cronus Market Intelligence, LLC for general information and education only. Impersonal research that does not consider any reader’s objectives, finances or needs; not an offer, solicitation or recommendation to buy, sell or hold any security. Cronus is not a registered investment adviser or broker-dealer. Historical studies are prepared with the benefit of hindsight; the definitions used (10% and 20% below a record, recession dating, 21 to 252 trading days) were chosen by us and other choices give different results. Signal figures describe how the signals performed on historical data and in validation; they are not a guarantee of future accuracy, and a signal can miss or fire falsely. Data come from third-party sources believed reliable but not guaranteed. Investing involves risk, including loss of all money invested. Past performance, actual or hypothetical, does not indicate future results. S&P 500 is a registered trademark of S&P Dow Jones Indices LLC, which does not sponsor or endorse this research; an index cannot be invested in directly. RegimeSignal is a trademark of Cronus Market Intelligence, LLC. © 2026 Cronus Market Intelligence, LLC.
RegimeSignal™ · Cronus Market Intelligence, LLC · Santa Barbara, California