“The S&P 500 enters its Turn-of-Year window tomorrow,” ran a widely shared post this week, with a chart showing that when Wayne Whaley’s TOY barometer rises 3% or more, the index finished the next year higher in 36 of 38 cases. We rebuilt the test from S&P 500 closes back to 1928, checked it against data its author never used, and set it beside our own warning signals and our election-cycle research.
The window opened at today’s close of 7,175.83, 8.2% below the October 6 record of 7,818.93. The Pullback and Correction signals are firing; the Bear signal is not.
We measured the S&P 500 from its close on November 19 (or the last close before it) to its close on January 19, then tracked the next 12 months, Jan 19 to Jan 19. Every figure in the widely shared table reproduces.
| TOY window, Nov 19 to Jan 19 (biggest return first) | Years | Next-year return | Worst drop in the year | Years up |
|---|---|---|---|---|
| Up more than 3% | 38 | +16.7% | −10.8% | 36 of 38 |
| All years | 76 | +9.4% | −13.4% | 56 of 76 |
| Up 0% to 3% | 20 | +6.6% | −12.1% | 13 of 20 |
| Down (adverse, worst last) | 18 | −2.6% | −20.5% | 7 of 18 |
TOY windows from November 1949 to January 2025. Averages across years; worst drop is peak to trough inside each year. S&P 500 price only.
Whaley did not start with November 19. He had a computer test every stretch of the year from 7 to 90 days and kept the one with the best record. Any rule picked that way looks better than it is, because the search rewards luck. We reran his search: of 22,589 windows we tested, 667 matched or beat 94.7%.
The fair test is data the rule never saw. There are two stretches: the 21 years before 1950, and the 12 years since the study was published in 2013.
| Period (biggest edge first) | Strong TOY: years up | Other years: years up | Strong TOY: avg return | Other: avg return |
|---|---|---|---|---|
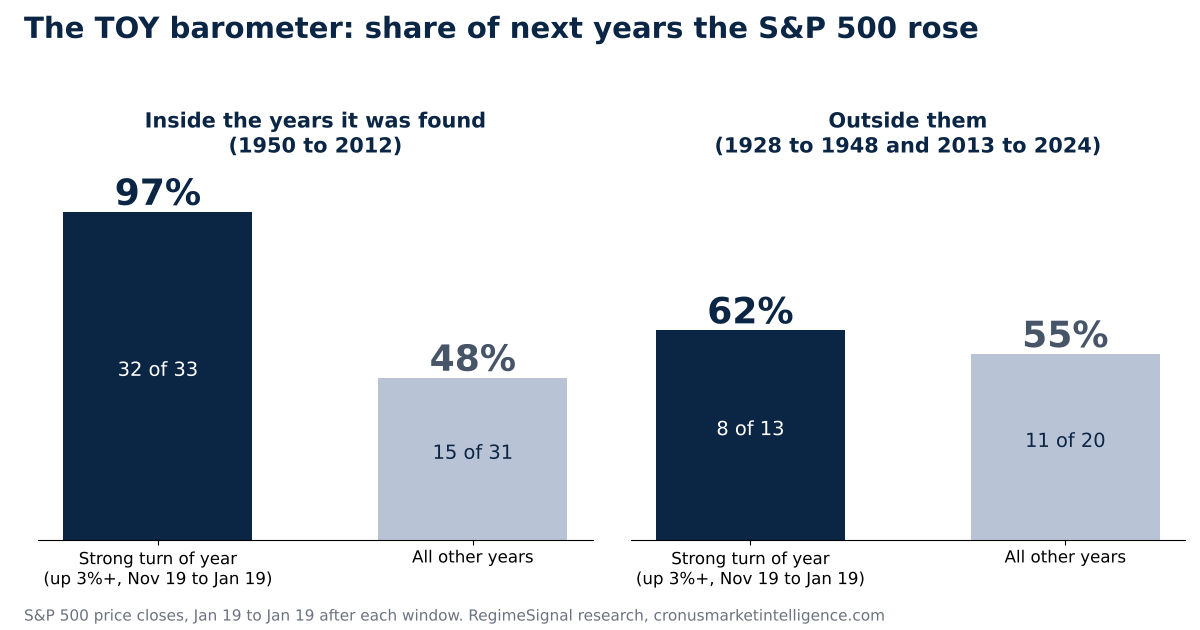
| 1950 to 2012 (the years it was found in) | 32 of 33 | 15 of 31 | +16.9% | +0.3% |
| Outside them, combined | 8 of 13 | 11 of 20 | +8.2% | +3.8% |
| 2013 to 2024 (since publication) | 4 of 5 | 5 of 7 | +15.3% | +10.6% |
| 1928 to 1948 (before the study) | 4 of 8 | 6 of 13 | +3.7% | +0.2% |
Strong = Nov 19 to Jan 19 gain of more than 3%. Samples outside the study years are small; read them as direction, not proof.
There is some real seasonality underneath. Two-month windows starting anywhere from mid-November to early December all have strong records, and a 3% two-month gain at any other time of year does less. But Nov 19 sits at the top of that season, which is where a search would land.
The barometer reads one number a year, and its worst misses came from inside the year. In 1986 the window rose 13.3% and the next 12 months held the 1987 crash, a 33.5% drop. In 2019 it rose 6.7% and the next year held the COVID crash, a 33.9% drop. Since 1950 a drop of 15% or more came in 7 of 38 strong years and 17 of 38 others. Better odds, but no protection.
RegimeSignal’s Correction signal is firing: 63% against its 50% fire level, scored on November data. It reads the odds of a 10% S&P 500 decline within about four months, and out of sample it was right 84% of the time it fired. The Pullback signal (5% declines) reads 96% against 66%. The Bear signal, for 20% declines, is not firing.
The market is already most of the way there. Today’s close is 8.2% below the October 6 record. A 10% correction from that record is a close at 7,037, just 1.9% below today.
| Since 1950, after the first close 8% below a record | Episodes | Share |
|---|---|---|
| Went on to a 10% correction before a new high | 25 of 35 | 71% |
| Reached 10% within three months | 23 of 35 | 66% |
| Went on to a 20% bear market | 12 of 35 | 34% |
| S&P 500 higher 12 months later | 23 of 34 | 68% |
Each decline counted once, from its first close 8% or more below the prior record until a new record. November 19, 2026 is such a first close and is not included. Average 12-month return after the first 8% close: +8.3%.
A correction would also set up the TOY reading. From 7,037 the S&P 500 would need to gain 5.0% by January 19 to post a strong reading.
December has been one of the better months: since 1950 it rose 72% of the time, by an average 1.4%, against 60% and 0.8% for all months. December in a midterm year has been softer: up 63% of the time (12 of 19), by 0.8%.
The year after a midterm is where the calendar is strongest. A midterm-year TOY window leads straight into the pre-election year. Since 1950 the S&P 500 was higher over those 12 months 16 of 19 times, by an average of 14.5%, and it barely mattered what the TOY window did. Strong readings were followed by gains 12 of 13 times; weak or negative readings 4 of 6 times, by an average 15.3%. Our election-cycle research found the first half of the pre-election year rose 22 of 24 times since 1928.
Starting from a decline changes the reading. When the window opened 5% or more below a record, as it did today, a strong reading was followed by an up year 25 of 26 times, and a weak one only 9 of 18 times, averaging +0.6%. That is inside the study years, so it carries the same caution as the headline figure.
| S&P 500 close on Tuesday, Jan 19, 2027 (best first) | TOY reading | Since 1950: next year up |
|---|---|---|
| Above 7,391 | Strong | 36 of 38 |
| 7,176 to 7,391 | Neutral | 13 of 20 |
| Below 7,176 | Negative | 7 of 18 |
7,391 is 3% above the November 19, 2026 close of 7,175.83. January 18, 2027 is a market holiday.
Don’t treat the TOY barometer as a 95% call. Outside its own years it has been a coin flip with a slight lean. For 2027 the calendar leans positive mainly because it is the year after a midterm, and that has held whatever the turn of the year did. The near-term risk is the part the calendar can’t see. The Correction signal is firing and the S&P 500 is 1.9% from a 10% correction. History says a good 2027 and a correction this winter can both happen.
See today’s market call and which warning signals are firing →Free 15-minute preview · no signup · no credit card · no downloadS&P 500 index daily closes (^GSPC, Yahoo Finance), December 1927 to November 19, 2026, price only. TOY window: last close on or before November 19 to last close on or before January 19; next year: that close to the last close on or before the following January 19; each year counted once. Worst drop is the largest peak-to-trough decline inside the next year. Window search: every calendar start date and every length from 7 to 90 days, windows with at least 20 strong years since 1950, next 365 days measured from each window’s end. Midterm years are even years not divisible by four. Decline episodes run from the first close 8% or more below the prior record to the next record. December figures use month-end closes, 1950 to 2025. Signal figures are RegimeSignal’s published readings and out-of-sample precision. Past results do not indicate future results.
The Turn-of-Year (TOY) barometer, published by Wayne Whaley in 2013, measures the S&P 500's price change from the November 19 close to the January 19 close. A gain of more than 3% has been read as a sign the next 12 months will be positive; a loss as a warning.
On the years it was built from, very. Since 1950 a gain of more than 3% was followed by a higher S&P 500 a year later 36 of 38 times. Outside the years it was found in (1928 to 1948 and 2013 to 2024) a strong reading was right 8 of 13 times, against 11 of 20 for all other years, so its real edge looks far smaller than 95%.
The window opened at the November 19, 2026 close of 7,175.83. A close above 7,391 on January 19, 2027 is a strong reading; below 7,176 is a negative reading; anything between is neutral.
As of November 19, 2026, RegimeSignal's Correction signal was firing at 63% against its 50% fire level, and the Pullback signal at 96% against 66%; the Bear signal was not firing. The S&P 500 closed 8.2% below its October 6 record, 1.9% above the 10% correction line of 7,037. Since 1950, 25 of 35 declines that first reached 8% went on to 10% before a new high.
It has been. Since 1950 the S&P 500 was higher in the 12 months after the midterm-year TOY window 16 of 19 times, by an average of 14.5%, and even weak TOY readings were followed by gains in 4 of 6 midterm years.
More studies: stock market correction or bear market? · midterm elections and the stock market · is the stock market going to crash? · when to buy stocks · all research.
Try RegimeSignal free for 15 minutes →No signup · no credit card · no download. Then a 7-day free trial; plans from $29 a month. See every plan on regimesignalai.com.Important disclosures. Published by Cronus Market Intelligence, LLC for general information and education only. Impersonal research that does not consider any reader’s objectives, finances or needs; not an offer, solicitation or recommendation to buy, sell or hold any security. Cronus is not a registered investment adviser or broker-dealer. Historical studies are prepared with the benefit of hindsight; the definitions used (the November 19 to January 19 window, the 3% cut-off, Jan 19 to Jan 19 forward years, price returns for the S&P 500) follow the published barometer or were chosen by us, and other choices give different results. The TOY Barometer is the work of Wayne Whaley and is cited as publicly reported; every figure here is our own calculation. Signal figures describe how the signals performed on historical data and in validation; they are not a guarantee of future accuracy, and a signal can miss or fire falsely. Data come from third-party sources believed reliable but not guaranteed. Investing involves risk, including loss of all money invested. Past performance, actual or hypothetical, does not indicate future results. S&P 500 is a registered trademark of S&P Dow Jones Indices LLC, which does not sponsor or endorse this research; an index cannot be invested in directly. RegimeSignal is a trademark of Cronus Market Intelligence, LLC. © 2026 Cronus Market Intelligence, LLC.
RegimeSignal™ · Cronus Market Intelligence, LLC · Santa Barbara, California