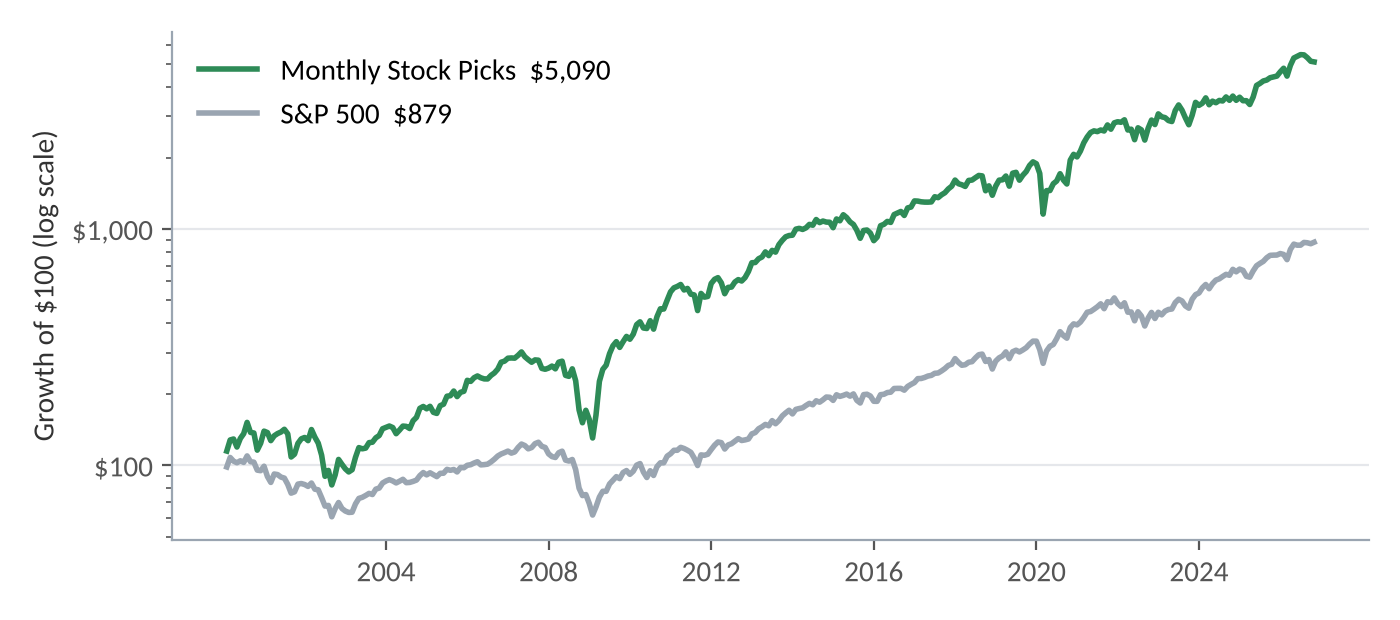
RegimeSignal ranks every stock in the S&P 500 each month and publishes two model portfolios from that work. Both are tested the same way: a walk-forward backtest using only information available at the time, index membership as it actually stood each month, and a 0.35% trading cost on every change. Since October 2026 every pick is also recorded live.
| Core Stock Picks | Monthly Stock Picks | S&P 500 | |
|---|---|---|---|
| Return a year, 15 years | 20.3% | 16.5% | 14.8% |
| Return a year, 20 years | — | 15.7% | 10.9% |
| Calendar years ahead of the S&P 500 | 12 of 15 (80%) | 18 of 25 (72%) | — |
| Rebuilt | Every quarter | Every month | — |
| Worst fall, Feb 2010 to now (adverse) | −29.2% | −39.9% | −23.9% |
Backtest through September 2026, live from October 2026. Core has no 20-year figure because its company-filing data begins in 2010. Hypothetical results, not an account.
See today’s market call and the live stock lists →Free 15-minute preview · no signup · no credit card · no downloadDownload the full research paper (PDF, 6 pages)
A ranking model that reads price behavior and money flows moves quickly, so it works best when the list is refreshed often. Company value measures from financial filings move slowly, so they suit a list held for a quarter. Together they give a faster list with a longer record and a steadier list with stronger results since 2010.
At each month-end close the model scores every S&P 500 stock on how likely it is to beat the average stock over the next month, weighing price momentum and short-term reversal, volatility and beta, trend, trading liquidity and money flow, sector strength and the market environment (rates, the Federal Reserve, the yield curve, inflation and the index’s own trend). No single input decides a pick; the exact weighting is proprietary. The model is refit each January on earlier data only.
The highest-ranked tenth of the S&P 500, about 50 stocks, no sector above 40% of the list, equal-weighted and rebuilt every month-end. Since February 2000 it returned 15.8% a year against 8.4% for the S&P 500, with a deeper worst fall (−56.8% against −50.8%, including 2008).
Core adds what a price model cannot see: what the business earns for the price paid. Each stock is ranked on free cash flow yield, sales yield, earnings yield and growth-adjusted value, taken from SEC filings as they were first filed, and that value rank is averaged with the ranking model. The top tenth is held, no sector above 40%, rebuilt at the January, April, July and October month-ends. The rule was chosen on 2011 to 2017 data only; on 2018 to September 2026, years it never saw, it returned 17.5% a year against 14.5% for the S&P 500.
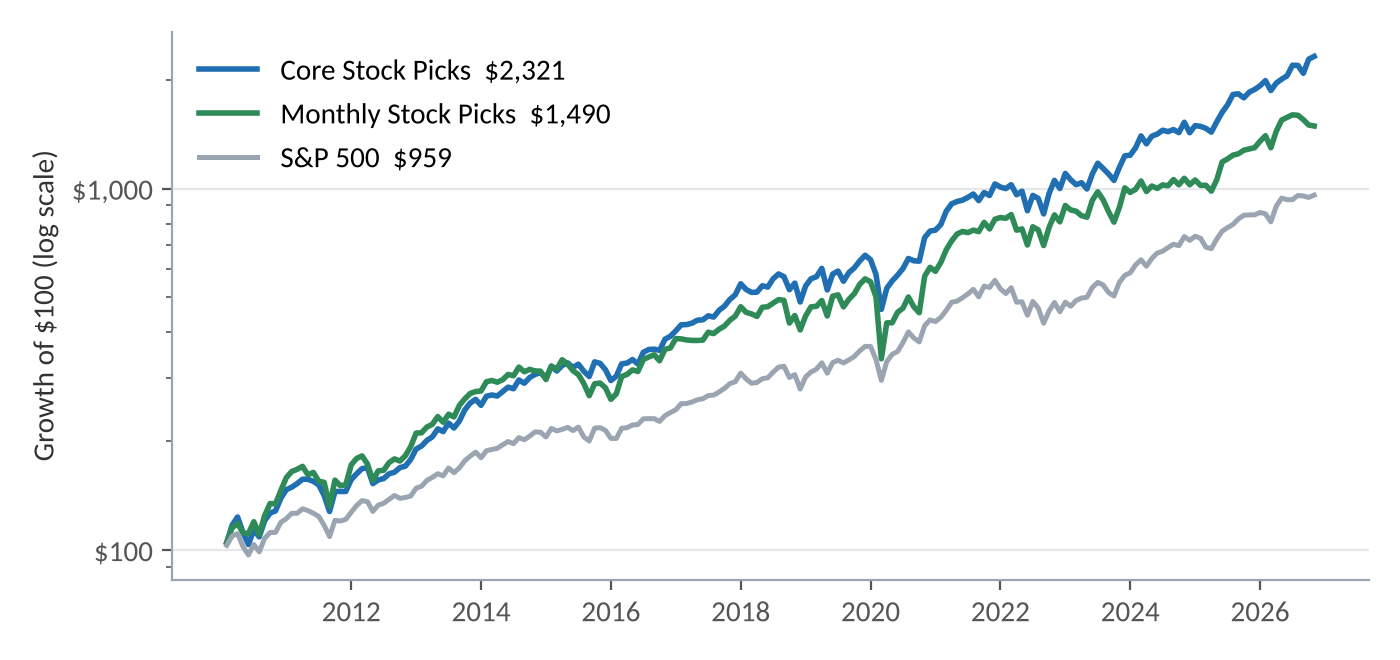
| Feb 2010 to Nov 4, 2026 | Core | Monthly | S&P 500 |
|---|---|---|---|
| Return a year | 20.5% | 17.4% | 14.4% |
| Sharpe ratio | 1.03 | 0.77 | 0.91 |
| Rolling 5-year periods ahead | 100% | 78% | — |
| Annual volatility (adverse) | 18.4% | 22.3% | 14.2% |
| Beta (adverse) | 1.16 | 1.35 | 1.00 |
| Worst fall from a peak (adverse) | −29.2% | −39.9% | −23.9% |
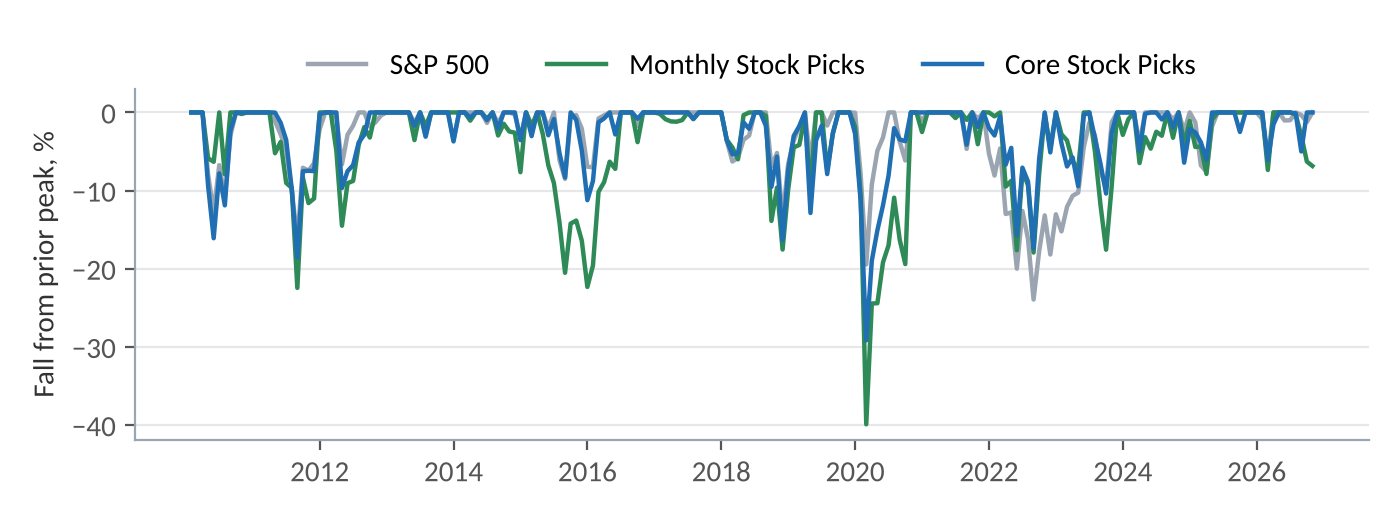
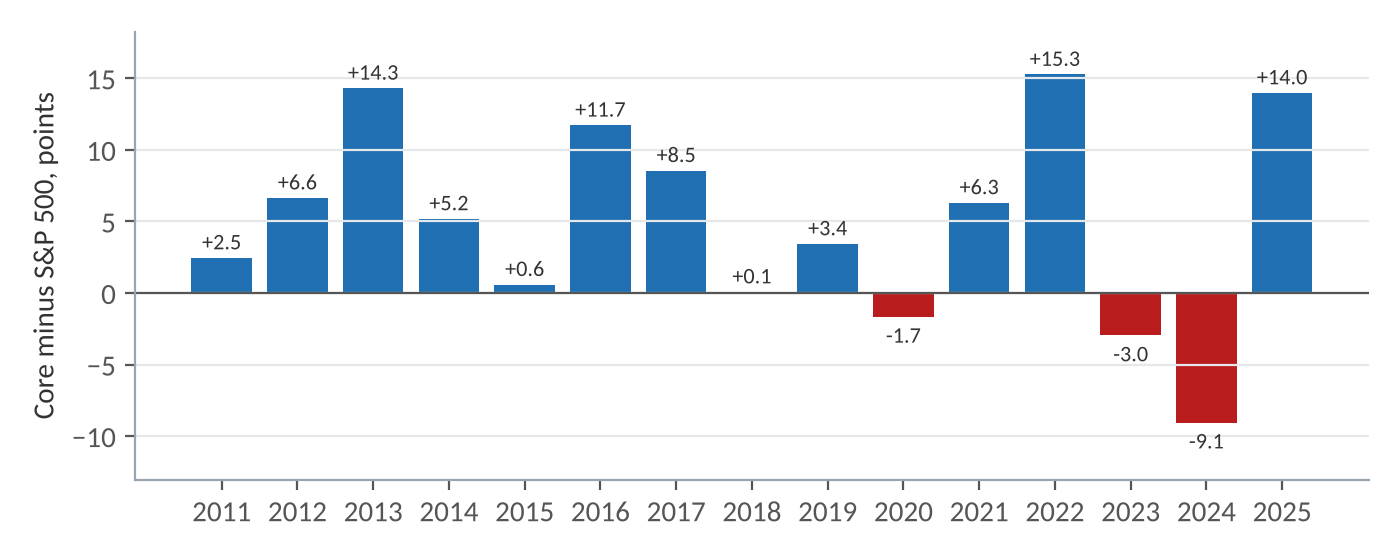
Current lists are for subscribers. These lists have finished their holding periods. Price change only, before dividends; S&P 500 over the same days.
Core Stock Picks, chosen July 31, 2026, held to October 30: the 49 stocks averaged +5.7% against +1.4% for the S&P 500; 29 of 49 beat it.
| Ticker | Company | Sector | Result |
|---|---|---|---|
| IT | Gartner | Information Technology | +51.5% |
| PTC | PTC Inc. | Information Technology | +42.5% |
| GDDY | GoDaddy | Information Technology | +41.7% |
| CRM | Salesforce | Information Technology | +24.8% |
| LDOS | Leidos | Industrials | +24.1% |
| KLAC | KLA Corporation | Information Technology | -13.5% |
| UAL | United Airlines Holdings | Industrials | -14.1% |
| DECK | Deckers Brands | Consumer Discretionary | -15.4% |
Monthly Stock Picks, October 2026: the 50 stocks averaged -3.1% against -0.9% for the S&P 500; 27 of 50 beat it.
| Ticker | Company | Sector | Result |
|---|---|---|---|
| ERIE | Erie Indemnity | Financials | +20.1% |
| FICO | Fair Isaac | Information Technology | +20.0% |
| NCLH | Norwegian Cruise Line Holdings | Consumer Discretionary | +19.8% |
| LYB | LyondellBasell | Materials | +19.4% |
| HII | Huntington Ingalls Industries | Industrials | +18.7% |
| TER | Teradyne | Information Technology | -31.6% |
| SNDK | Sandisk | Information Technology | -33.9% |
| INTC | Intel | Information Technology | -45.3% |
Five best and three worst of each list. One quarter and one month are examples, not evidence. Companies named are illustrations only, not recommendations.
Backtest: every figure before October 2026 is hypothetical, not an account. Coverage: removed companies are partly missing, especially before 2013, so early years are likely overstated; from 2015 to 2025, with near-full coverage, Monthly Stock Picks ran about even with the index (13.8% against 13.4%) while Core returned 17.8%. Leadership: both lists are equal-weighted and can trail badly when a few of the largest stocks lead, as in 2023 and 2024. Risk: both carry more market risk than the S&P 500. Selection: Core was the best of many rules tried on 2011 to 2017, so part of its lead may be chance.
Try RegimeSignal free for 15 minutes →No signup · no credit card · no download. Plans start with a 7-day free trial, $0 today, cancel anytime.Important disclosures. Published by Cronus Market Intelligence, LLC for general information and education only. Impersonal research that does not consider any reader’s objectives, finances or needs; not an offer, solicitation or recommendation to buy, sell or hold any security. Cronus is not a registered investment adviser or broker-dealer. Except where marked live (from October 2026), results are hypothetical: produced by applying rules to historical data with the benefit of hindsight, with rules and settings chosen after the periods they describe; they do not reflect actual trading, market impact, slippage, taxes or fees, and real results may differ materially, including losses. Results assume equal weighting, month-end or quarter-end rebuilds and a 0.35% trading cost; data come from SEC filings and third-party sources believed reliable but not guaranteed. Investing involves risk, including loss of all money invested. Past performance, actual or hypothetical, does not indicate future results. Cronus, its owner and staff may hold securities mentioned. S&P 500 figures use SPY with dividends; an index cannot be invested in directly. S&P 500 is a registered trademark of S&P Dow Jones Indices LLC, which does not sponsor or endorse this research. RegimeSignal is a trademark of Cronus Market Intelligence, LLC. © 2026 Cronus Market Intelligence, LLC.
RegimeSignal™ · Cronus Market Intelligence, LLC · Santa Barbara, California